Download
1 / 38
380 likes | 522 Views
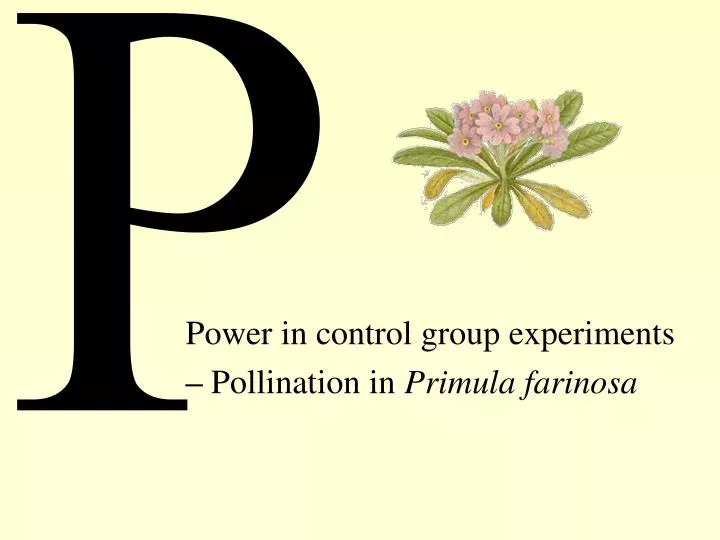
P. Power in control group experiments – Pollination in Primula farinosa. Primula farinosa scape morphs. Hand pollination experiment. Long- and short- scaped plants Hand pollination vs. open-pollinated controls 4 populations Year 2001 & 2002 4-factor anova. Overview.

E N D
P Power in control group experiments–Pollination in Primula farinosa
Hand pollination experiment • Long- and short- scaped plants • Hand pollination vs. open-pollinated controls • 4 populations • Year 2001 & 2002 • 4-factor anova
Overview • Very basic introduction to power analyses. [ overbasic ? ] • How to simulate datasets in R. [ fake data] • How to use the fake data to estimate power of a study and thus be able to choose sample sizes. • Play a bit with R. [ powerplay ] • Explore power in control group experiments.
Long Mean: 85% fruit set Mostly between 45% and 100% standard deviation 20% Mostly ≈ 95 % Short Mean: 70% fruit set Mostly between 30% and 100% standard deviation 20%
How many plants do I have to sample to get a statisticly significant difference? 10 + 10 ? 30 + 30 ? 100 + 100 ?
n <- 30 long.y <- rnorm(n,mean=0.85,sd=0.20) long.y <-ifelse(long.y <0,0,ifelse(long.y>1,1,long.y)) short.y <- rnorm(n,mean=0.70,sd=0.20) short.y<-ifelse(short.y <0,0,ifelse(short.y >1,1, short.y)) scape.morph <- c(rep("Long",n),rep("Short",n)) scape.morph <- factor(scape.morph) fruit.set<-c(long.y,short.y)
prim.anova <- aov(fruit.set ~ scape.morph) summary(prim.anova)
prim.anova <- aov(fruit.set ~ scape.morph) summary(prim.anova)
prim.anova <- aov(fruit.set ~ scape.morph) summary(prim.anova)
n <- 30 long.y <- rnorm(n,mean=0.85,sd=0.20) long.y <-ifelse(long.y <0,0,ifelse(long.y>1,1,long.y)) short.y <- rnorm(n,mean=0.70,sd=0.20) short.y<-ifelse(short.y <0,0,ifelse(short.y >1,1, short.y)) scape.morph <- c(rep("Long",n),rep("Short",n)) scape.morph <- factor(scape.morph) fruit.set<-c(long.y,short.y) prim.anova <- aov(fruit.set ~ scape.morph) summary(prim.anova) # Graphic shitty code: plot(1,1,type="n",bty="n",xaxt="n",yaxt="n",xlab="",ylab="") text(1,1,paste("p.value = ",signif(unlist(summary(prim.anova))[9],2)),cex=3, col=ifelse(unlist(summary(prim.anova))[9]<0.05,"red","black"))
Do this 100 times! for (i in 1:100){ n <- 30 long.y <- rnorm(n,mean=0.85,sd=0.20) long.y <-ifelse(long.y <0,0,ifelse(long.y>1,1,long.y)) short.y <- rnorm(n,mean=0.70,sd=0.20) short.y<-ifelse(short.y <0,0,ifelse(short.y >1,1, short.y)) scape.morph <- c(rep("Long",n),rep("Short",n)) scape.morph <- factor(scape.morph) fruit.set<-c(long.y,short.y) prim.anova <- aov(fruit.set ~ scape.morph) summary(prim.anova) }
Create empty box Do this 100 times! p.values <- NULL for (i in 1:100){ n <- 30 long.y <- rnorm(n,mean=0.85,sd=0.20) long.y <-ifelse(long.y <0,0,ifelse(long.y>1,1,long.y)) short.y <- rnorm(n,mean=0.70,sd=0.20) short.y<-ifelse(short.y <0,0,ifelse(short.y >1,1, short.y)) scape.morph <- c(rep("Long",n),rep("Short",n)) scape.morph <- factor(scape.morph) fruit.set<-c(long.y,short.y) prim.anova <- aov(fruit.set ~ scape.morph) p.values[i]<-unlist(summary(prim.anova))[9] } p.values sum(p.values < 0.05) # Graphic shitty code: plot(1,1,type="n",bty="n",xaxt="n",yaxt="n",xlab="",ylab="") text(1,1.2,"Times with significant p-value:",cex=2) text(1,1,sum(p.values<0.05),cex=3) Show what’s in the box!
Create empty box Do this 100 times! # Histogram shitty code: pow<-length(p.values[p.values<0.05])/100 hist(p.values,breaks=seq(0,1,.05),col=c("red",rep("white",19)),xaxt="n", main="100 simulations with scape morph effect", xlab="p-values", ylim=c(0,100)) axis(1,c(0,.5,1),labels=c(0,0.5,1)) axis(1,at=0.05,lwd=2,col="red",col.axis="red",font=2,tcl=-2,padj=2) text(0.5,30,bquote(paste("Power ",phantom() %~~%phantom(.),.(pow))), adj=0) p.values <- NULL for (i in 1:100){ n <- 30 long.y <- rnorm(n,mean=0.85,sd=0.20) long.y <-ifelse(long.y <0,0,ifelse(long.y>1,1,long.y)) short.y <- rnorm(n,mean=0.70,sd=0.20) short.y<-ifelse(short.y <0,0,ifelse(short.y >1,1, short.y)) scape.morph <- c(rep("Long",n),rep("Short",n)) scape.morph <- factor(scape.morph) fruit.set<-c(long.y,short.y) prim.anova <- aov(fruit.set ~ scape.morph) p.values[i]<-unlist(summary(prim.anova))[9] } sum(p.values < 0.05) # Graphic shitty code: plot(1,1,type="n",bty="n",xaxt="n",yaxt="n",xlab="",ylab="") text(1,1.2,"Times with significant p-value:",cex=2) text(1,1,sum(p.values<0.05),cex=3)
To avoid: Let’s take at least 30 + 30 !
p = 0.012 (sweet!)
Now, Is the higher fruit set in the long morph really a result of higher attraction to pollinators?
This requieres an experiment with hand pollination. But how many plants would I need to hand pollinate?
A) 15 per group. That is same sample as before, but hand pollinating half of them.
B) 30 per group. That is, 30 + 30 as before, and an extra 30 + 30 for hand pollination.
C) To much isn’t enough! 50 per group. That is, 100 long + 100 short, and hand pollinating half of them.
Long Control Mean: 85% fruit set Mostly between 45% and 100% standard deviation 20% Long Hand pollination Mean: 85% fruit set Mostly between 45% and 100% standard deviation 20% Short Control Mean: 70% fruit set Mostly between 30% and 100% standard deviation 20% Short Hand pollination Mean: 85% fruit set Mostly between 45% and 100% standard deviation 20%
n <- 15 long.c <- rnorm(n,mean=0.85,sd=0.20) short.c <- rnorm(n,mean=0.70,sd=0.20) long.hp <- rnorm(n,mean=0.85,sd=0.20) short.hp <- rnorm(n,mean=0.85,sd=0.20) long.c <-ifelse(long.c <0,0,ifelse(long.c>1,1,long.c)) short.c<-ifelse(short.c <0,0,ifelse(short.c >1,1, short.c)) long.hp <-ifelse(long.hp <0,0,ifelse(long.hp>1,1,long.hp)) short.hp<-ifelse(short.hp <0,0,ifelse(short.hp >1,1, short.hp)) fruit.set<-c(long.c,short.c,long.hp,short.hp) scape.morph <- c(rep("Long",n),rep("Short",n), rep("Long",n),rep("Short",n)) pollination<-c(rep("Control",2*n),rep("Hand",2*n)) scape.morph <- factor(scape.morph) pollination<- factor(pollination)
poll.anova <- aov(fruit.set ~ scape.morph * pollination) summary(poll.anova)
n <- 15 long.c <- rnorm(n,mean=0.85,sd=0.20) short.c <- rnorm(n,mean=0.70,sd=0.20) long.hp <- rnorm(n,mean=0.85,sd=0.20) short.hp <- rnorm(n,mean=0.85,sd=0.20) long.c <-ifelse(long.c <0,0,ifelse(long.c>1,1,long.c)) short.c<-ifelse(short.c <0,0,ifelse(short.c >1,1, short.c)) long.hp <-ifelse(long.hp <0,0,ifelse(long.hp>1,1,long.hp)) short.hp<-ifelse(short.hp <0,0,ifelse(short.hp >1,1, short.hp)) fruit.set<-c(long.c,short.c,long.hp,short.hp) scape.morph <- c(rep("Long",n),rep("Short",n), rep("Long",n),rep("Short",n)) pollination<-c(rep("Control",2*n),rep("Hand",2*n)) scape.morph <- factor(scape.morph) pollination<- factor(pollination) poll.anova <- aov(fruit.set ~ scape.morph * pollination) summary(poll.anova) # Graphic shitty code: plot(1,1,type="n",bty="n",xaxt="n",yaxt="n",xlab="",ylab="") text(1,1,paste("* p.value = ",signif(unlist(summary(poll.anova))[19],2)),cex=3, col=ifelse(unlist(summary(poll.anova))[19]<0.05,"red","black"))
p.values <- NULL for (i in 1:100){ n <- 15 long.c <- rnorm(n,mean=0.85,sd=0.20) short.c <- rnorm(n,mean=0.70,sd=0.20) long.hp <- rnorm(n,mean=0.85,sd=0.20) short.hp <- rnorm(n,mean=0.85,sd=0.20) long.c <-ifelse(long.c <0,0,ifelse(long.c>1,1,long.c)) short.c<-ifelse(short.c <0,0,ifelse(short.c >1,1, short.c)) long.hp <-ifelse(long.hp <0,0,ifelse(long.hp>1,1,long.hp)) short.hp<-ifelse(short.hp <0,0,ifelse(short.hp >1,1, short.hp)) fruit.set<-c(long.c,short.c,long.hp,short.hp) scape.morph <- c(rep("Long",n),rep("Short",n), rep("Long",n),rep("Short",n)) pollination<-c(rep("Control",2*n),rep("Hand",2*n)) scape.morph <- factor(scape.morph) pollination<- factor(pollination) poll.anova <- aov(fruit.set ~ scape.morph * pollination) p.values[i]<-unlist(summary(poll.anova))[19] } sum(p.values < 0.05) # Graphic shitty code: plot(1,1,type="n",bty="n",xaxt="n",yaxt="n",xlab="",ylab="") text(1,1.2,"Times with significant p-value:",cex=2) text(1,1,sum(p.values<0.05),cex=3)
Conclusion! To maintain power: Four-double sample size! That is: double within-group sample size! This holds for every level of interactions…
My hand pollination experiment 4-factor anova 4-way interaction Scape Morph [2] Pollination [2] Population [4] Year [2] 60*4 = 240 240 *4 = 960 960*8 = 7680 i.e., 240 per group of which 3840 shouldbe hand pollinated i.e., 1920 per year
Control Fertilized Germinated Germinated Prob of Germination Prob of Germination Didn’t germinate Didn’t germinate Seed size Seed size
X<-c(76,85,78,67,72) repeat { x<-sample(c(76,85,78,67,72,65,66,80),5) plot(1,1,type="n",bty="n",xaxt="n",yaxt="n",xlab="",ylab="",xlim=c(0,6),ylim=c(0,2)) points(1:5,rep(1,5),pch=x,xlim=c(0,6),cex=3) if (X[1]==X[1] & X[2]==x[2] & X[3]==x[3] & X[4]==x[4] & X[5]==x[5]) break } repeat { x<-c(76,sample(c(76,85,78,67,72,84),4)) plot(1,1,type="n",bty="n",xaxt="n",yaxt="n",xlab="",ylab="",xlim=c(0,6),ylim=c(0,2)) points(1:5,rep(1,5),pch=x,xlim=c(0,6),cex=3) if (X[1]==x[1] & X[2]==x[2] & X[3]==x[3] & X[4]==x[4] & X[5]==x[5]) break } repeat { x<-c(76,85,sample(c(67,72,75,76,78,90:93),3)) plot(1,1,type="n",bty="n",xaxt="n",yaxt="n",xlab="",ylab="",xlim=c(0,6),ylim=c(0,2)) points(1:5,rep(1,5),pch=x,xlim=c(0,6),cex=3) if (X[1]==x[1] & X[2]==x[2] & X[3]==x[3] & X[4]==x[4] & X[5]==x[5]) break } repeat { x<-c(76,85,78,sample(c(67,72,75,76:90),2)) plot(1,1,type="n",bty="n",xaxt="n",yaxt="n",xlab="",ylab="",xlim=c(0,6),ylim=c(0,2)) points(1:5,rep(1,5),pch=x,xlim=c(0,6),cex=3) if (X[1]==x[1] & X[2]==x[2] & X[3]==x[3] & X[4]==x[4] & X[5]==x[5]) break } repeat { x<-c(76,85,78,67,sample(c(65:100,73:100),1)) plot(1,1,type="n",bty="n",xaxt="n",yaxt="n",xlab="",ylab="",xlim=c(0,6),ylim=c(0,2)) points(1:5,rep(1,5),pch=x,xlim=c(0,6),cex=3) if (X[1]==x[1] & X[2]==x[2] & X[3]==x[3] & X[4]==x[4] & X[5]==x[5]) break }