Download
1 / 43
440 likes | 462 Views
Issues Being Addressed in the 22 nd Actuarial Report on the Canada Pension Plan as at 31 December 2006. Presentation to the Board of Directors of the Canada Pension Plan Investment Board. 5 June 2006. Presentation. Purpose of the CPP Actuarial Report Demographic and Economic Assumptions

E N D
Issues Being Addressed in the 22nd Actuarial Report on the Canada Pension Planas at 31 December 2006 Presentation to the Board of Directors of the Canada Pension Plan Investment Board 5 June 2006
Presentation • Purpose of the CPP Actuarial Report • Demographic and Economic Assumptions • Main findings • Steady-State Funding • Peer Review Process • Next Actuarial Report – Reference portfolio • Issues Looking Forward
Purpose of the CPP Triennial Actuarial Report • 21st Actuarial Report Tabledby the Minister of Finance on8 December 2004 • Inform on the current and projected future financial status of the Canada Pension Plan • Calculate the steady-state contribution rate
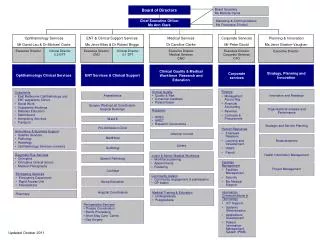
Responsibilities of the Office of the Chief Actuary Public Pensions Reporting Act • CPP Act • Statutory report & amendments • Triennial financial review • Chief Actuary • Independent reviewers • Outside experts (seminars) • CIA Standards of Practice • International Standards Treasury Board & Pension Advisory Committees CPP Stakeholders Federal – Provincial Committee PSPIB CPPIB Public Parliament
Presentation • Purpose of the CPP Actuarial Report • Demographic and Economic Assumptions • Main findings • Steady-State Funding • Peer Review Process • Next Actuarial Report – Reference portfolio • Issues Looking Forward
Demographic Assumptions Age Profile of Canada's Population, 1951 & 2001 100 Female 95 Male 90 85 80 75 70 65 60 55 50 1946-1965 in 2001 45 2001 40 35 1951 30 25 20 15 10 5 0 300,000 200,000 100,000 0 100,000 200,000 300,000 • Fertility (Number of births) • Migration • Mortality (Life expectancy) • Disability Rates • Retirement Rates } Benefit Assumptions
Increase in Life Expectancies More predictable Life expectancy at 65 Difference More contributors are expected to reach the retirement age of 65. Retirement beneficiaries are expected to receive their benefits for a longer period.
Working Ageand Total Population(Canada) 45 40 35 Total 20-64 30 25 20 Annual increases: Total 20-64 D 1980-2000 +1.1% +1.4% D 2000-2020 +0.8% +0.8% D 2020-2040 +0.5% +0.1% 15 10 5 0 1980 1990 2000 2010 2020 2030 2040 2050 (in millions) 2003 After 2025, almost all projected population increase will come from migration.
Economic Assumptions } • Participation rates • Employment increase (Job creation rate) • Unemployment rate • Inflation rate • Increase of average employment earnings • Interest rate and rate of return by asset class # of earners Sources: Historical trends, Recent experience, PEAP from U of T., Department of Finance estimates, Conference Board, Report on Canadian Economic Statistics by CIA, CPPIB, Watson Wyatt Economic Expectations Survey, CPP seminars
Presentation • Purpose of the CPP Actuarial Report • Demographic and Economic Assumptions • Main findings • Steady-State Funding • Peer Review Process • Next Actuarial Report – Reference portfolio • Issues Looking Forward
Main Findings – 21st CPP Actuarial Report • Despite the projected substantial increase in expenditures as a result of the aging of the population, the actuarial report confirms that the Plan will meet its obligations and remain financially sustainable over the projection period. • From 2004 to 2021, contributions are more than sufficient to cover expenditures. (until 2014 for QPP) • Asset/Expenditure ratio increases from 3.1 to 5.6 over that period and reaches 6.3 in 2050.
Main Findings – 21st CPP Actuarial Report (Ratio) 8.0 7.0 9.9% Legislated contribution rate 9.8% Steady-state rate 6.0 5.0 4.0 In 2020, CPP/QPP assets are projected to be equal to 17% of the GDP. 3.0 2.0 1.0 0.0 2005 2015 2025 2035 2045 2055 2065 2075 Asset/Expenditure Ratio
Presentation • Purpose of the CPP Actuarial Report • Demographic and Economic Assumptions • Main findings • Steady-State Funding • Peer Review Process • Next Actuarial Report – Reference portfolio • Issues Looking Forward
CPP Steady-State Funding • The current legislated contribution rate is 9.9%. • The steady-state contribution rate is 9.8%. • If the legislated contribution rate is higher than the steady-state rate, the funding status of the Plan will increase over time. • The higher this rate is set above the steady-state rate, the faster the Plan will become more funded.
CPP Steady-State Funding • If legislated contribution rate is lower than thesteady-state rate AND if finance ministers cannotreach agreement on a solution, then default provisions apply: • Contribution rate increased by ½ of excess over three years, subject to maximum increase of 0.2% per year • Benefits frozen until next review (3 years) • At end of three years, next review performed to determine financial status of Plan.
CPP Steady-State Funding Sources of Income • CPP follows the 70:30 Rule (Contributions:Investment Earnings). • When the A/E ratio reaches approximately 5.0, 30% of revenues will come from investment earnings. • Sources of income of fully-funded pension plans are the opposite (the 30:70 Rule). How annual benefits are paid • Until 2022, contributions exceed benefits. Once the A/E ratio reaches about 5.0, annual contributions will equal approximately 90% of annual benefits paid.
CPP Steady-State Funding Percent of investment earnings used to pay benefits
Presentation • Purpose of the CPP Actuarial Report • Demographic and Economic Assumptions • Main findings • Steady-State Funding • Peer Review Process • Next Actuarial Report – Reference portfolio • Issues Looking Forward
Independent Peer Review Process • Auditor General and Selection Process • Overseeing of the Peer Review by the UK Government Actuary’s Department • The Independent Review Panel confirmed: • That actuarial standards of practice were met; • That assumptions were reasonable; • That the report fairly communicates the results; • The actuarial conclusions reached by the Chief Actuary aboutthe soundness of the CPP. • and made a series of recommendations. March 2005
Strengthening the Accountability • Federal and provincial governments took meaningful steps to strengthen the transparency and accountability of actuarial reporting. They endorsed : • an increase in the frequency of actuarial reporting from every five years to every three years; • regular consultations by the Chief Actuary with experts on assumptions to be used in actuarial reports; • regular peer reviews of future actuarial reports on the CPP.
Presentation • Purpose of the CPP Actuarial Report • Demographic and Economic Assumptions • Main findings • Steady-State Funding • Peer Review Process • Next Actuarial Report – Reference portfolio • Issues Looking Forward
CPP Actuarial Report as at 31 December 2006 • Stochastic analysis • Determine confidence intervals for assumptions such as fertility, migration, wages increases, investment returns • Uncertainty of results • a new section will be added explaining the uncertainty involved in estimating future contribution rates • CPP reference portfolio and asset mix • Assumptions influenced by the opinion of the peer reviewers
Historical Fertility Rate (Children per woman) Geometric Mean (1941-2002) = 2.5 Geometric Mean (1977-2002) = 1.6
Fertility Rates (1977-2002) 1.58 1.59 1.61 1.62 1.64 1.65 1.67 Stochastic Analysis 20-year periods 100% High-Cost 1.3 Low-Cost 1.9 µ = 1.62 σ = 0.02 Steady-State between 10.1% and 9.5%
Historical Net Migration Rates Geometric Mean (1972-2003) = 0.5%
Net Migration Rates (1972-2003) Stochastic Analysis 20-year periods 5% 95% µ = 0.50% σ = 0.05% Steady-State between 9.9% and 9.6%
Historical Increase in Real Wages Geometric Mean (1924-2003) = 1.4%
Real Wage Increase (1924-2003) Stochastic Analysis 20-year periods 12% 4% 84% µ = 1.4% σ = 0.5% Steady-State between 10.3% and 9.2%
Historical Canadian Equity Return Geometric Mean (1939-2003) = 6.0% σ = 16.4%
Real Rates of Return (1939-2003) CPP 21 Projected Asset Mix Stochastic Analysis 20-year periods 59% 15% 26% µ = 5.7% σ = 2.4% Steady-State between 10.3% and 9.3%
Real Rates of Return (1938-2005) CPP 21 Projected Asset Mix Stochastic Analysis 20-year periods 62% 14% 24% µ = 5.8% σ = 2.5%
Uncertainty of Resultsand potential volatility of future contribution rates A/E Ratio Under Alternative Population Scenarios (Steady-State) 8 8 7 7 10.3% 9.8% 6 6 5 5 9.3% 4 4 3 3 2 2 1 1 0 0 2004 2014 2024 2034 2044 2054 2064 2074 Younger Population Best-Estimate Older Population Recommendation #4: Apply more sophisticated stochastic analysis to develop more consistent sensitivity tests.
Asset Mix Assumption (CPP 21) • Peer review of CPP 18 stated that CPPIB has not yet adopted a long-term asset mix policy. • Short-term asset mix was provided in the CPPIB Annual Report for fiscal year 2004. • Expected asset mix in fiscal year 2006 • 35% fixed income securities • 65% variable income securities • Since OCA takes a long-term view of the CPP, it is necessary to formulate a long-term assumption about the CPPIB asset mix even though little guidance was provided by the CPPIB at that time. In that regard, the OCA most welcomes the concept of a notional CPP reference portfolio.
Asset Mix Assumption (CPP 21) • From 2006-2020 • 65% Variable Income • 35% Fixed Income • Transition period from 2021-2024 (QPP transition period from 2015-2025: 70%-30% to 60%-40%) • After 2025 • 55% Variable Income • 45% Fixed Income
Alternative Asset Mix Scenarios Contribution Rate Expected Net Cash Flow 2007-2016 Last Year of Positive Net Cash Flow Percent of Investment Earnings to Pay Benefits in 2050 100% EquitiesCPP 21100% Bonds (65%-35%) 9.5% 9.9% 10.5% $24.4 B $40.2 B $63.9 B 2018 2021 2026 41.2% 29.2% 22.7% « A 65-35 Policy Embodies Stewards’ Revealed Risk Preference »
Sustainability of the 9.9% Contribution Rate Under Extreme Conditions for the next 6 years (2004-2009)
Real Rates of Return (1938-2005) CPP Reference Portfolio(10% Real Return Bonds) Stochastic Analysis Consecutive 6-year periods 63% 25% 12% µ = 6.3% σ = 4.8%
Real Rates of Return (1938-2005) CPP Reference Portfolio(10% Real Return Bonds) Stochastic Analysis 20-year periods 61% 16% 23% µ = 5.8% σ = 2.7%
Presentation • Purpose of the CPP Actuarial Report • Demographic and Economic Assumptions • Main findings • Steady-State Funding • Peer Review Process • Next Actuarial Report – Reference portfolio • Issues Looking Forward
Issues Looking Forward • Economic value of the pension promise • Actuarial study on optimal funding of the CPP
Economic Value of Pension Promise • What would be the implications of purchasing a benefit equal to the CPP in the private annuity market? 1. Cost of purchasing an annuity that will provide monthly benefit equal to max CPP benefit 2. Implied rate of return on annuity purchased in the private market if CPP mortality assumptions are used 3. Cost of purchasing an annuity that earns the return assumed in CPP21 and assumes CPP mortality • Only 2/3 of the CPP benefit can be provided by an insurance provider for the same capital.
Normal Cost vs Rate of Return * Normal cost for calendar year 2004
Optimal Funding of the CPP • OCA Actuarial Study • Examine different ways and objectives of funding a social insurance scheme • Discuss history and funding of the CPP • Examine appropriateness and robustness of CPP steady-state funding methodology using sensitivity analysis