Download
1 / 2
20 likes | 199 Views

E N D
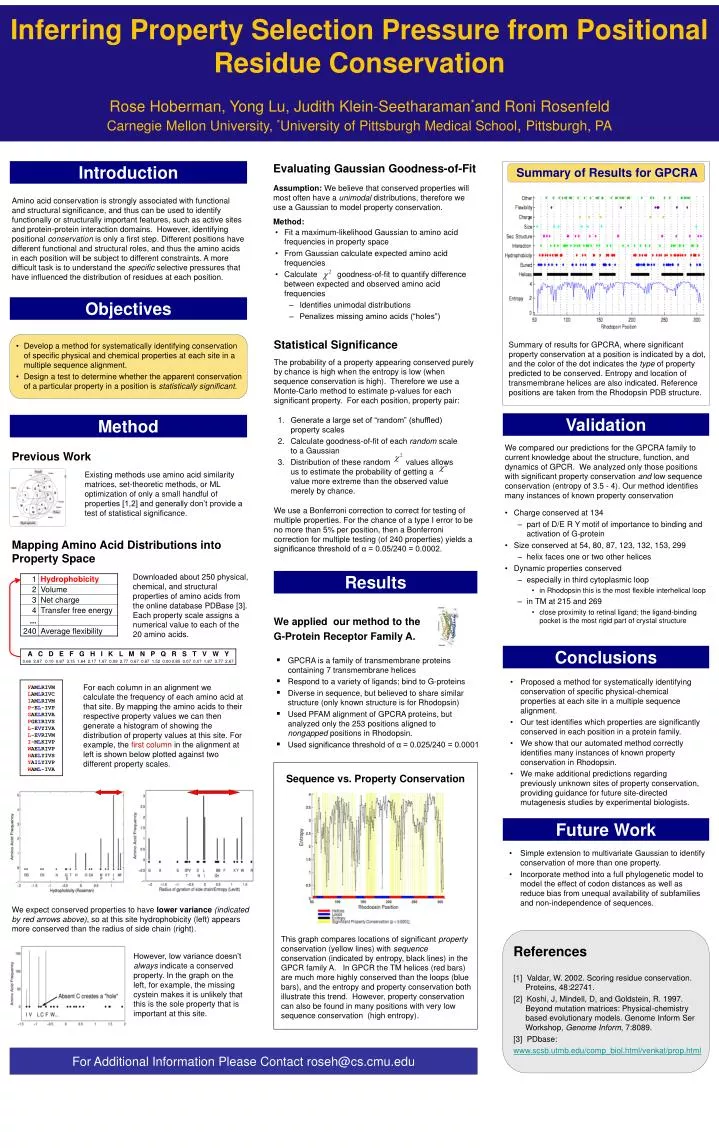
Amino acid conservation is strongly associated with functional and structural significance, and thus can be used to identify functionally or structurally important features, such as active sites and protein-protein interaction domains. However, identifying positional conservation is only a first step. Different positions have different functional and structural roles, and thus the amino acids in each position will be subject to different constraints. A more difficult task is to understand the specific selective pressures that have influenced the distribution of residues at each position. Inferring Property Selection Pressure from Positional Residue ConservationRose Hoberman, Yong Lu, Judith Klein-Seetharaman*and Roni RosenfeldCarnegie Mellon University, *University of Pittsburgh Medical School, Pittsburgh, PA Evaluating Gaussian Goodness-of-Fit Assumption: We believe that conserved properties will most often have a unimodal distributions, therefore we use a Gaussian to model property conservation. Method: Summary of Results for GPCRA Introduction • Fit a maximum-likelihood Gaussian to amino acid frequencies in property space • From Gaussian calculate expected amino acid frequencies • Calculate goodness-of-fit to quantify difference between expected and observed amino acid frequencies • Identifies unimodal distributions • Penalizes missing amino acids (“holes”) Objectives • Develop a method for systematically identifying conservation of specific physical and chemical properties at each site in a multiple sequence alignment. • Design a test to determine whether the apparent conservation of a particular property in a position is statistically significant. Statistical Significance The probability of a property appearing conserved purely by chance is high when the entropy is low (when sequence conservation is high). Therefore we use a Monte-Carlo method to estimate p-values for each significant property. For each position, property pair: • Generate a large set of “random” (shuffled) property scales • Calculate goodness-of-fit of each random scale to a Gaussian • Distribution of these random values allows us to estimate the probability of getting a value more extreme than the observed value merely by chance. We use a Bonferroni correction to correct for testing of multiple properties. For the chance of a type I error to be no more than 5% per position, then a Bonferroni correction for multiple testing (of 240 properties) yields a significance threshold of α = 0.05/240 = 0.0002. Summary of results for GPCRA, where significant property conservation at a position is indicated by a dot, and the color of the dot indicates the type of property predicted to be conserved.Entropy and location of transmembrane helices are also indicated. Reference positions are taken from the Rhodopsin PDB structure. Validation Method We compared our predictions for the GPCRA family to current knowledge about the structure, function, and dynamics of GPCR. We analyzed only those positions with significant property conservation and low sequence conservation (entropy of 3.5 - 4). Our method identifies many instances of known property conservation Previous Work Existing methods use amino acid similarity matrices, set-theoretic methods, or ML optimization of only a small handful of properties [1,2] and generally don’t provide a test of statistical significance. • Charge conserved at 134 • part of D/E R Y motif of importance to binding and activation of G-protein • Size conserved at 54, 80, 87, 123, 132, 153, 299 • helix faces one or two other helices • Dynamic properties conserved • especially in third cytoplasmic loop • in Rhodopsin this is the most flexible interhelical loop • in TM at 215 and 269 • close proximity to retinal ligand; the ligand-binding pocket is the most rigid part of crystal structure Mapping Amino Acid Distributions into Property Space Results Downloaded about 250 physical, chemical, and structural properties of amino acids from the online database PDBase [3]. Each property scale assigns a numerical value to each of the 20 amino acids. We applied our method to the G-Protein Receptor Family A. • GPCRA is a family of transmembrane proteins containing 7 transmembrane helices • Respond to a variety of ligands; bind to G-proteins • Diverse in sequence, but believed to share similar structure (only known structure is for Rhodopsin) • Used PFAM alignment of GPCRA proteins, but analyzed only the 253 positions aligned to nongapped positions in Rhodopsin. • Used significance threshold of α = 0.025/240 = 0.0001 Conclusions • Proposed a method for systematically identifying conservation of specific physical-chemical properties at each site in a multiple sequence alignment. • Our test identifies which properties are significantly conserved in each position in a protein family. • We show that our automated method correctly identifies many instances of known property conservation in Rhodopsin. • We make additional predictions regarding previously unknown sites of property conservation, providing guidance for future site-directed mutagenesis studies by experimental biologists. FAMLRIVM LAMLRIVC IAMLRIVM P-EL-IVP GAELRIVA PGEIRIVS L-EVYIVA L-EVRIVM I-MLKIVP WAELRIVP HAELYIVS YAILYIVP WAML-IVA For each column in an alignment we calculate the frequency of each amino acid at that site. By mapping the amino acids to their respective property values we can then generate a histogram of showing the distribution of property values at this site. For example, the first column in the alignment at left is shown below plotted against two different property scales. Sequence vs. Property Conservation Future Work • Simple extension to multivariate Gaussian to identify conservation of more than one property. • Incorporate method into a full phylogenetic model to model the effect of codon distances as well as reduce bias from unequal availability of subfamilies and non-independence of sequences. We expect conserved properties to have lower variance (indicated by red arrows above), so at this site hydrophobicity (left) appears more conserved than the radius of side chain (right). This graph compares locations of significant property conservation (yellow lines) with sequence conservation (indicated by entropy, black lines) in the GPCR family A. In GPCR the TM helices (red bars) are much more highly conserved than the loops (blue bars), and the entropy and property conservation both illustrate this trend. However, property conservation can also be found in many positions with very low sequence conservation (high entropy). References [1] Valdar, W. 2002. Scoring residue conservation. Proteins, 48:22741. [2] Koshi, J, Mindell, D, and Goldstein, R. 1997. Beyond mutation matrices: Physical-chemistry based evolutionary models. Genome Inform Ser Workshop, Genome Inform, 7:8089. [3] PDbase: www.scsb.utmb.edu/comp_biol.html/venkat/prop.html However, low variance doesn’t always indicate a conserved property. In the graph on the left, for example, the missing cystein makes it is unlikely that this is the sole property that is important at this site. For Additional Information Please Contact roseh@cs.cmu.edu
3.3 Gaussian Goodness-of-Fit • Fit a maximum-likelihood Gaussian to amino acid frequencies in property space • From (discretized) Gaussian calculate expected AA frequencies • Calculate goodness-of-fit to learned Gaussian • Identifies unimodal distributions • Penalizes missing amino acids (“holes”) • Use Monte-Carlo method to calculate statistical significance (p-value) • Otherwise will have high false discovery rate when entropy is low • Estimating statistical significance • What is the probability of a property being conserved purely by chance? • Generate a large set of “random” (shuffled) property scales • Calculate goodness-of-fit to a Gaussian • p-value estimated from distribution of the statistic under “random” null-hypothesis However, the Bonferroni is an overly conservative adjustment, especially since there are significant correlations between many of the properties we are testing.