Download
1 / 2
20 likes | 89 Views
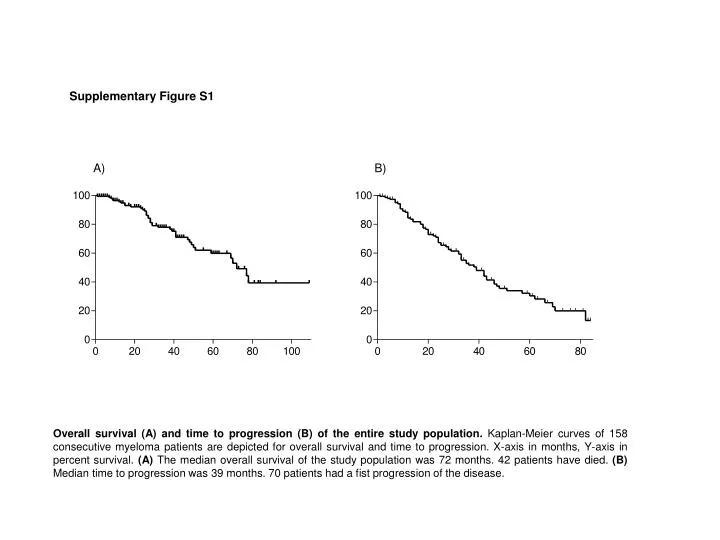
This supplementary figure presents the overall survival and time to progression data of 158 myeloma patients. The Kaplan-Meier curves illustrate the study population's median overall survival of 72 months and median time to progression of 39 months. Additionally, the distribution of circulating CD34+ cells at the day of stem cell collection is shown, distinguishing between super mobilizers and normal mobilizers based on the number of CD34+ cells per milliliter. The figure provides valuable insights into patient outcomes and stem cell collection efficacy in myeloma treatment.

E N D
Supplementary Figure S1A)B) Overall survival (A) and time to progression (B) of the entire study population. Kaplan-Meier curves of 158 consecutive myeloma patients are depicted for overall survival and time to progression. X-axis in months, Y-axis in percent survival. (A) The median overall survival of the study population was 72 months. 42 patients have died. (B) Median time to progression was 39 months. 70 patients had a fist progression of the disease.
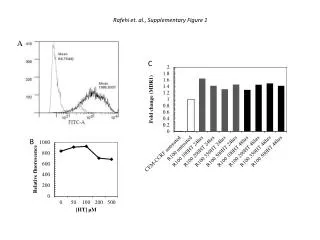
Supplementary Figure S2 super mobilizersn normal mobilizers Distribution of the number of circulating CD34+ cells at the day of stem cell collection from all 158 patients in this study. Waterfall diagram presentation of the number of CD34+ cells from all patients. The value of 100’000 CD34+ cells/ml separated the 69 super mobilizers (upper bars) from the 89 normal mobilizers (lower bars).