Download
1 / 5
50 likes | 190 Views
Expression of microRNAs-192 and -215 in human gastric cell lines. Supplementary Figure 1. Cell cycle assay. A. B. NCI-N87. HFE145. NSC-mim. NSC-inh. G1: 56.63±0.86% S: 20.07±2.39% G2/M: 23.13±2.51%. G1: 62.67±1.07% S: 17.37±1.42% G2/M: 20.17±0.42%. 192-mim. 192-inh.

E N D
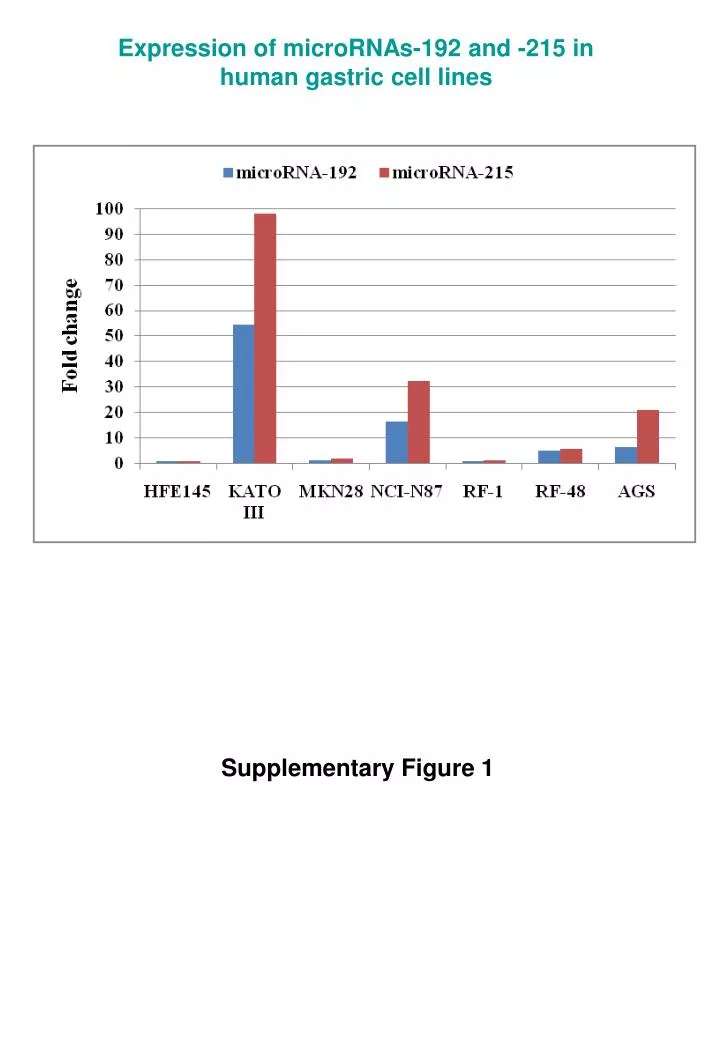
Expression of microRNAs-192 and -215 in human gastric cell lines Supplementary Figure 1
Cell cycle assay A B NCI-N87 HFE145 NSC-mim NSC-inh G1: 56.63±0.86% S: 20.07±2.39% G2/M: 23.13±2.51% G1: 62.67±1.07% S: 17.37±1.42% G2/M: 20.17±0.42% 192-mim 192-inh G1: 55.87±0.85% S: 19.77±2.46% G2/M: 23.77±1.69% G1: 64.43±0.42% S: 16.27±1.10% G2/M: 18.93±1.75% Cell count 215-mim 215-inh G1: 55.47±0.84% S: 20.03±2.31% G2/M: 23.87±1.54% G1: 65.00±0.36% S: 16.20±1.39% G2/M: 18.40±1.39% DNA content Supplementary Figure 2
Propidium Iodide Annexin-V-FITC Apoptosis assay A B HFE145 NCI-N87 NSC-mim NSC-inh 2.73±0.23% 2.47±0.23% 192-mim 192-inh 2.70±0.26% 3.50±0.36% 215-mim 215-inh 2.57±0.21% 2.73±0.29% Supplementary Figure 3
Correlation between ALCAM mRNA levels and microRNA-192 and -215 expression in human gastric tissues r=-0.0621, p=0.65 r=-0.2043, p=0.13 Supplementary Figure 4
A B C ALCAM expression by immunohistochemistry in human gastric tissue Supplementary Figure 5


