Download
1 / 39
390 likes | 455 Views
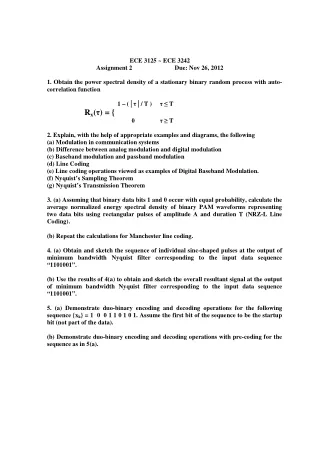
Understand the receiver structure, demodulation, and detection of digital signals for optimal signal recovery. Learn about matched filters, correlators, likelihood detectors, and reducing errors in the received signal.

E N D
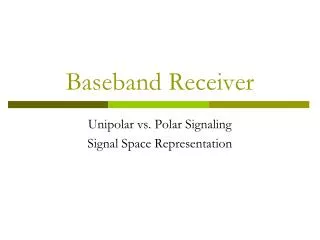
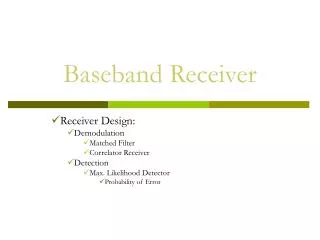
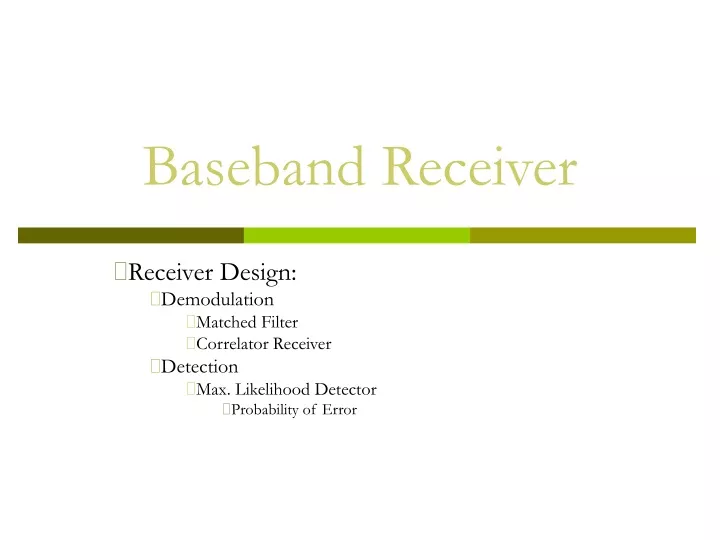
Baseband Receiver Receiver Design: Demodulation Matched Filter Correlator Receiver Detection Max. Likelihood Detector Probability of Error
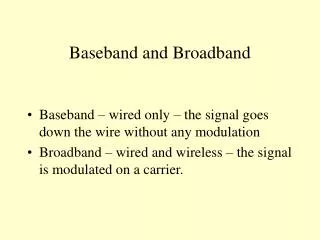
Sources of Error in received Signal • Major sources of errors: • Thermal noise (AWGN) • disturbs the signal in an additive fashion (Additive) • has flat spectral density for all frequencies of interest (White) • is modeled by Gaussian random process (Gaussian Noise) • Inter-Symbol Interference (ISI) • Due to the filtering effect of transmitter, channel and receiver, symbols are “smeared”.
Receiver Structure Demodulation/Detection of digital signals
Receiver Structure contd • The digital receiver performs two basic functions: • Demodulation • Detection • Why demodulate a baseband signal??? • Channel and the transmitter’s filter causes ISI which “smears” the transmitted pulses • Required to recover a waveform to be sampled at t = nT. • Detection • decision-making process of selecting possible digital symbol
Important Observation • Detection process for bandpass signals is similar to that of baseband signals. WHY??? • Received signal for bandpass signals is converted to baseband before detecting • Bandpass signals are heterodyned to baseband signals • Heterodyning refers to the process of frequency conversion or mixing that yields a spectral shift in frequency. • For linear system mathematics for detection remains same even with the shift in frequency
Steps in designing the receiver • Find optimum solution for receiver design with the following goals: • Maximize SNR • Minimize ISI • Steps in design: • Model the received signal • Find separate solutions for each of the goals.
Detection of Binary Signal in Gaussian Noise The recovery of signal at the receiver consist of two parts Filter Reduces the received signal to a single variable z(T) z(T) is called the test statistics Detector (or decision circuit) Compares the z(T) to some threshold level 0 , i.e., where H1and H0are the two possible binary hypothesis
Receiver Functionality The recovery of signal at the receiver consist of two parts: Waveform-to-sample transformation Demodulator followed by a sampler At the end of each symbol duration T, pre-detection point yields a sample z(T), called test statistic Where ai(T) is the desired signal component, and no(T) is the noise component Detection of symbol Assume that input noise is a Gaussian random process and receiving filter is linear
Finding optimized filter for AWGN channel Assuming Channel with response equal to impulse function
Detection of Binary Signal in Gaussian Noise For any binary channel, the transmitted signal over a symbol interval (0,T) is: The received signal r(t) degraded by noise n(t) and possibly degraded by the impulse response of the channel hc(t), is Where n(t) is assumed to be zero mean AWGN process For ideal distortionless channel where hc(t) is an impulse function and convolution with hc(t) produces no degradation, r(t) can be represented as:
Design the receiver filter to maximize the SNR • Model the received signal • Simplify the model: • Received signal in AWGN AWGN Ideal channels AWGN
Find Filter Transfer Function H0(f) Objective: To maximizes (S/N)T and find h(t) Expressing signal ai(t) at filter output in terms of filter transfer function H(f) where H(f) is the filter transfer funtion and S(f) is the Fourier transform of input signal s(t) If the two sided PSD of i/p noise is N0/2 Output noise power can be expressed as: Expressing (S/N)T :
For H(f) = Hopt (f) to maximize (S/N)T use Schwarz’s Inequality: Equality holds if f1(x) = k f*2(x) where k is arbitrary constant and * indicates complex conjugate Associate H(f) with f1(x) and S(f) ej2 fT with f2(x) to get: Substitute yields to:
Or and energy E of the input signal s(t): Thus (S/N)T depends on input signal energy and power spectral density of noise and NOT on the particular shape of the waveform Equality for holds for optimum filter transfer function H0(f) such that: (3.55) For real valued s(t):
The impulse response of a filter producing maximum output signal-to-noise ratio is the mirror image of message signal s(t), delayed by symbol time duration T. The filter designed is called a MATCHED FILTER Defined as: a linear filter designed to provide the maximum signal-to-noise power ratio at its output for a given transmitted symbol waveform
A filter that is matched to the waveform s(t), has an impulse response h(t) is a delayed version of the mirror image (rotated on the t = 0 axis) of the original signal waveform Correlation realization of Matched filter Impulse response of matched filter Mirror image of signal waveform Signal Waveform
Correlator Receiver • This is a causal system • a system is causal if before an excitation is applied at time t = T, the response is zero for - < t < T • The signal waveform at the output of the matched filter is • Substituting h(t) to yield: • When t=T So the product integration of rxd signal with replica of transmitted waveform s(t) over one symbol interval is called Correlation
Correlator Matched Filter Correlator versus Matched Filter • The functions of the correlator and matched filter • The mathematical operation of Correlator is correlation, where a signal is correlated with its replica • Whereas the operation of Matched filter is Convolution, where signal is convolved with filter impulse response • But the o/p of both is same at t=T so the functions of correlator and matched filter is same.
Implementation of matched filter receiver Bank of M matched filters Matched filter output: Observation vector
Implementation of correlator receiver Bank of M correlators Correlators output: Observation vector
Example of implementation of matched filter receivers Bank of 2 matched filters 0 T t 0 T T 0 0 T t
Detection Max. Likelihood Detector Probability of Error
Detection Matched filter reduces the received signal to a single variable z(T), after which the detection of symbol is carried out The concept of maximum likelihood detectoris based on Statistical Decision Theory It allows us to formulate the decision rule that operates on the data optimize the detection criterion
P[s0], P[s1] a priori probabilities These probabilities are known before transmission P[z] probability of the received sample p(z|s0), p(z|s1) conditional pdf of received signal z, conditioned on the class si P[s0|z], P[s1|z] a posteriori probabilities After examining the sample, we make a refinement of our previous knowledge P[s1|s0], P[s0|s1] wrong decision (error) P[s1|s1], P[s0|s0] correct decision Probabilities Review
Maximum Likelihood Ratio test and Maximum a posteriori (MAP) criterion: If else Problem is that a posteriori probabilities are not known. Solution: Use Bay’s theorem: How to Choose the threshold? This means that if received signal is positive, s1 (t) was sent, else s0 (t) was sent
1 Likelihood of So and S1
MAP criterion: • When the two signals, s0(t) and s1(t), are equally likely, i.e., P(s0) = P(s1) = 0.5, then the decision rule becomes • This is known as maximum likelihood ratio test because we are selecting • the hypothesis that corresponds to the signal with the maximum likelihood. • In terms of the Bayes criterion, it implies that the cost of both types of error is the same
Hence: • Taking the log, both sides will give
Hence where z is the minimum error criterion and 0 is optimum threshold For antipodal signal, s1(t) = - s0 (t) a1 = - a0
Probability of Error Error will occur if s1 is sent s0 is received s0 is sent s1 is received • The total probability of error is sum of the errors
If signals are equally probable Hence, the probability of bit error PB, is the probability that an incorrect hypothesis is made Numerically, PBis the area under the tail of either of the conditional distributions p(z|s1) or p(z|s0)
The above equation cannot be evaluated in closed form (Q-function) Hence,
Co-error function • Q(x) is called the complementary error function or co-error function • Is commonly used symbol for probability • Another approximation for Q(x) for x>3 is as follows: • Q(x) is presented in a tabular form
Imp. Observation To minimize PB, we need to maximize: or Where (a1-a2) is the difference of desired signal components at filter output at t=T, and square of this difference signal is the instantaneous power of the difference signal i.e. Signal to Noise Ratio