Download
1 / 64
640 likes | 760 Views
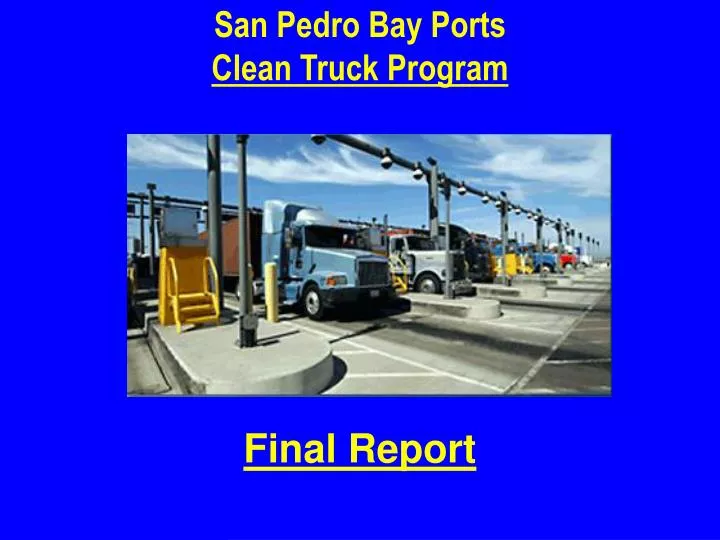
San Pedro Bay Ports Clean Truck Program. Final Report. Process: Interviews. 403 IOOs in line at Gates Over 50 LMCs most One-on-One 136 LMC by Telephone Other: National Truckers with LMCs & Employees Beneficial Cargo Owners ILWU Teamsters Non-Port LMCs Terminal Operator

E N D
San Pedro Bay PortsClean Truck Program Final Report
Process: Interviews • 403 IOOs in line at Gates • Over 50 LMCs most One-on-One • 136 LMC by Telephone • Other: • National Truckers with LMCs & Employees • Beneficial Cargo Owners • ILWU • Teamsters • Non-Port LMCs • Terminal Operator • So. California AQMD
Process • Research – Literature & Statistics • Financials • Regulation • Security • Pay • Benefits • CARB • Technology • Industrial Real Estate • Truck Prices • Tax Codes • Economic Reports
Process • Conduct Analysis • Structure of Current Industry • Impact of TWIC • Clean Truck Program: LMC-IOO Model • Clean Truck Program: Owned Trucks/Employee Drivers • Possible Market Changes • Analyze Economic Impacts of Program • Analyze Unintended Consequences • Oversight - Effectively None
DPM Reduction -782 tons -81%
NOx Reduction -6,228 tons -61%
AQMD Economic Calculation Cumulative Health Effects Clean Air Benefit: 2008-2025 CARB Off-Road Rule Methodology: Median at $5.9 billion CARB Off-Road Rule Methodology: Median at $4.7 billion AQMP MethodologyMedian at $5.4 billion 230-1,450 Premature Deaths Avoided: 95% of Economic Impact
Economic Reports • Long Beach 2001: 315,611 Direct & Indirect Jobs • PPIC 2004: $240.4 Billion; 24.4% U.S. Two-Way Port Trade • ACTA 2005: 1,114,660 Jobs in CA, NV, AZ, NM, CO, UT • LAEDC 2005: All Trade = 450,100 Direct Jobs; 6.4% 5 Co. • McGMAP 2005: Port Trade = 740,103 Total Jobs; 8.8% 7-Co. • McGMAP 2030: Port Trade = 1.6 million if 42.5 million TEU
What Happens If CAAP Fails & The Ports Are Not Allowed To Build Planned Infrastructure? Port growth restrained to 2/3 of 42.5 million TEU capacity … 300,000 jobs not created Port growth restrained to 1/3 of 42.5 million TEU capacity … 600,000 jobs not created
Where Is Port Drayage Capacity? 800 - 1,200 Licensed Motor Carriers 83.1% 79.4% 76.2% 40.6% 25.2%
95% of Revenue To Costs $934,000 In Physical Assets Form “M” $3 - $5 Million Revenue Upper Limit Little Borrowing Power
Nature of LMCs Service Firms Arranging for Cargo Moves Most Are Not Asset Based Trucking Firms Relatively Thin Financial Strength
Little Pricing Power Highly Competitive, Small Companies, No Barriers To New Firms Entering Business Vs. Limited Number of Large Ocean Shipping Lines Very Powerful Beneficial Cargo Owners
IOO’s – Own & Maintain Trucks Move Containers Who Enters Gate: 85% Are IOOs 15% Mostly Fleet Employee? 20% Yes, 48% Maybe, 32% No
IOO Net Income Median Hourly Net Income $12.37 per Hour (Dr. Monaco) $11.60 per Hour (Gateway Study)
Oversight 90-Day Vehicle Safety & Maintenance Check (CV 34505.5) Drivers Logs Insurance (often through LMC) Records Must Be Kept
Records Maintained By IOOs & LMCs CHP Bi-Annual Inspection Program(CV 34501.12) – 90-Day Records Check CHP has Budget to do about 50% of Required Audits
IOOs: 22% Definitely Won’t Apply For TWIC 21% May Not LMC: Loss of 0% to 20% • Assumed Range: 15% to 22% • May Change Mind • IOO Survey • Homeland Security • Hazmat • Criminal Records • Loss of 2,500 to 3,700
Find 2,500-3,700 Other Trucks To Clean-Up Finding 2,500-3,700 Drivers Challenges
Driver Pay In Southern California • IOOs not in Port Drayage: Inland Empire ($18.09) $20.08 • LA Employee-Drivers (Bottom 33%: $16.45) $21.72 • IE Employee Drivers (Bottom 33%: $17.65 ) $22.67 • Construction Workers (Bottom 33%: $17.33) $21.94 Assumed Need to Pay $20 per Hour To Replace TWIC Remember: Aging Work Force & Turnover Also Affecting Pay
LMC Must Pay IOO 70% $75,000 • LMC has Non-Driver Costs 25% $26,800 • LMC Net: 5%$ 5,400 • Required Revenue: $107,100 • $75,000 gross - $46,000 Cost = Net: $29,000 • $20 per hour, 50 weeks, 50 hours = Net: $50,000 • Holding Other Expenses at: $46,000 • Needed Gross Income: $96,000 24.3% Increase In Prices • LMC Must Pay IOO Gross of: $96,000 • LMC has Non-Driver Costs $26,800 • LMC Wants to increase net 5.0% to 7.8%$10,700 • Required Revenue: $137,100
Import Transportation Cost For most movements, trucking cost is small $150 to $187 or $300 to $373 vs. $2,575 On $70,000 per container (0.05% or 0.1%) Rail Truck 1. US customs declared value
Crisis Path Down Field Vision Two Paths
Driver Need TWIC & Port Growth2% Per Year Efficiency Increase 13,100 + 3,700 TWIC + 3,400 Growth = 20,200 54.5% 14,300 + 2,500 TWIC + 3,400 Growth = 20,200 41.5%
TIF LMC Has An IOO with a truck not up to Clean Air Standards TIF estimate $34 to $54. Assume $50. Average Trips 308 x $50 = $15,400 Pressure on IOO To Clean Up Truck Immediately
IOO Clean Truck Options • Retrofit (36.8%) $20,000 From Grant Fund $212,000,000 • IOO Borrow • Purchase (63.2%) $80,000 From Grant Fund $850,000,000 • No Tax on Grant $0 • Borrow $28,500 Very Hard • Port Lien Truck for 80%. Lender in 2nd Position for 20% • Marginal Personal FICO Credit Score • Need Loan Guarantee Program LMC’s Customers Pay 63.2% of $28,500 = $18,000 Per Truck Per Year
LMC Must Pay IOO Gross of 70% $75,000 • LMC has Non-Driver Costs 25% $26,800 • LMC Net: 5%$10,700 • Required Revenue: $107,100 • $20 per hour, 50 weeks, 50 hours = Net: $50,000 • Holding Other Expenses at: $46,000 • Needed Gross Income: $96,000 48.6% Increase In Prices • LMC Must Pay IOO Gross of: $96,000 • LMC has Non-Driver Costs Due to Move Volume: $34,400 • Assist IOO With Truck ($28,500) 63.2% Replaced$18,000 • LMC Wants to increase net 5.0% to 6.7%$10,700 • Required Revenue: $159,200
Import Transportation Cost $150 to $223 or $300 to $446 vs. $2,575 On $70,000 per container (0.1% or 0.2%) Rail Truck 1. US customs declared value
Fleet Modernization Grant Fund Incentive To Self Retrofit Fund Difficulties: 8.9% Self Retrofit Prop 1B Immediate need of clean up to avoid TIF
Crisis Path Down Field Vision Two Paths
Three Parts to Clean Air Program • Clean-up Trucks • Employee Drivers • Yard for Parking, Maintenance, Inspection
TIF LMC Has An IOO with a truck not up to Clean Air Standards TIF estimate $34 to $54. Assume $50. Average Trips 308 x $50 = $15,400 Pressure on LMCs To Clean Up Truck Immediately
Lender in Second Position on New Trucks Weak Balance Sheets $362,200 Net Worth 5.29% Return on Equity 2.19% Return on Capital Cash Required By LMCs of Various Sizes 50% Retrofit, 50% Replace Average Cash Per Truck: $47,902
Employee-Driver Costs 2,000 hours x $20.00 = $40,000 225 hours x $30.00 = $ 6,750 $46,750 $60,310 $29,000
$60,310 x 1.283 = $77,398 $29,000 Workers Have Less Time, Need More For Same Work 28.3%
Other Costs & Cost Offsets Non-Driver Operating Costs Slip-Seating Technology
Combined Cost Replace IOO Truck Cost Per Vehicle (50% Retro-50% New) $47,902 Employee Replace IOO + 28.3% More Staff $77,398 Yard $21,237 Total $146,537
LMC Must Pay IOO Gross of 70% $75,000 • LMC has Non-Driver Costs 25% $26,800 • LMC Net: 5% $10,700 • Required Revenue: $107,100 • $20 per hour, 50 weeks, 50 hours = Net: $50,000 • Holding Other Expenses at: $46,000 • Needed Gross Income: $96,000 80% Increase In Prices • LMC Must Pay IOO Gross of: $146,500 • LMC has Non-Driver Costs Due to Move Volume: $34,400 • Assist IOO With Truck ($28,500) 63.2% Replaced $ 0 • LMC Wants to increase net 5.0% to 5.6%$10,700 • Required Revenue: $191,700
Import Transportation Cost $150 to $270 or $300 to $540 vs. $2,575 On $70,000 per container (0.17% or 0.34%) Rail Truck 1. US customs declared value
Crisis Path Two Paths Down Field Vision
Beneficial Cargo Owner Executive’sLikely View of Price Increase 200 Containers a Week 10,400 per Year $300 to Move $3,100,000 $540 to Move (80%) $5,600,000 $2,500,000 Increase