Download
1 / 11
110 likes | 124 Views
Discover the reality of water scarcity on Earth, where less than 3% is fresh water and only 1% is accessible and usable by humans. Learn about groundwater, aquifers, percolation, water table, and the impact of excessive pumping on the environment.

E N D
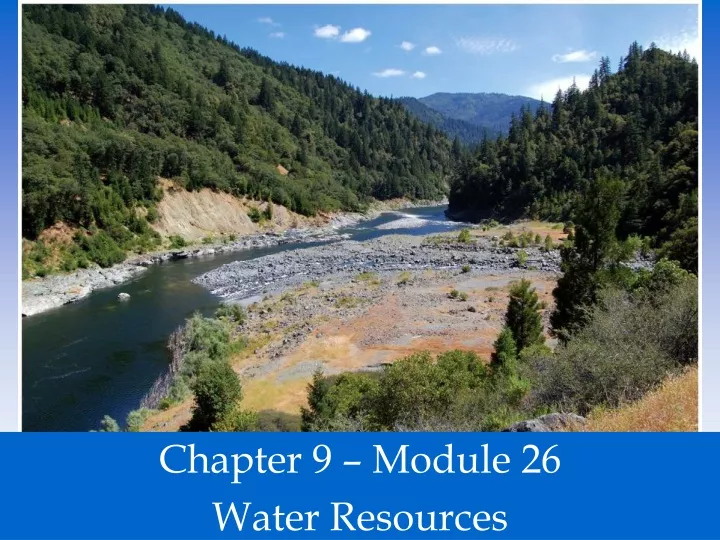
Chapter 9 – Module 26 Water Resources
Usable Water is Rare “Water, water everywhere nor any drop to drink…” ~ Samuel Taylor Coleridge 1798 Do the Math: What is 0.47% of 2.78%? Distribution of water on Earth. Fresh water represents less than 3% of all water on Earth, and over three-fourths of that fresh water is frozen as ice and glaciers. Over 20% is underground – often too deep to reach. Therefore, less than 1 percent of all water on the planet is accessible and usable by humans.
Groundwater • Aquifers -small spaces found within permeable layers of rock and sediment where water is found. • Unconfined aquifers - an aquifer that is simply porous rock covered by soil. • Confined- an aquifer trapped by a layer of impermeable rock or clay. which can cause water pressure to build up underground. • Artesian wells are formed when a well is drilled into a confined aquifer and the natural pressure causes water to rise toward the ground surface. Create a diagram like this…
The Ogallala aquifer The Ogallala aquifer, also called the High Plains aquifer, is the largest in the United States, with a surface area of about 174,000 miles2. (a) The change in water level from 1950 to 2005, mostly due to withdrawals for irrigation that have exceeded the aquifer’s rate of recharge. (b) The current thickness of the aquifer.
Porosity • the percentage of a rock or sediment that consists of open spaces …like skin “pores” p.397
Permeability Percolation • the process of a liquid (water) seeping into the ground – like a percolating coffee maker: • the ability of a rock or sediment to let fluids pass through its open spaces, or pores p.398
Groundwater • Water table - the uppermost level at which the water in an area fully saturates the rock or soil. • Recharge - A process by which water percolates through the soil and works its way into an aquifer. • Springs - water from an aquifer that naturally percolates up to the surface.
Groundwater • Cone of depression - when a well pumps water from an aquifer more rapidly than it can be recharged, it can form a cone of depression in the water table and cause nearby shallow wells to go dry.
Subsidence • Excessive groundwater pumping allowed soil to dry out and compact, which is by far the single largest cause of subsidence. • Soil compaction reduces the pore sizes between soil particles, resulting in essentially a permanent condition—rewetting of the underground soil and rock does not cause the land to go back up in altitude. This results in a lessening of the total storage capacity of the aquifer system. Here, the term "groundwater mining" is really true. • http://water.usgs.gov/edu/gallery/landsubsidence-poland.html
Groundwater • Saltwater intrusion- when the pumping of fresh water out of a well is faster than the recharge. Near coastal areas this can cause salt water to infiltrate the aquifer.
Surface Water • Surface water is water that exists aboveground and includes steams, rivers, ponds, and wetlands. Tracking Global Surface Water Dynamics with Landsat http://landsat.gsfc.nasa.gov/11761/