Download
1 / 30
300 likes | 315 Views
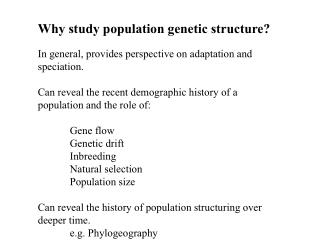
Explore continuous and discrete-time models in population biology, from logistic growth to survivorship curves and transition matrix modeling. Discover age distributions, fecundity rates, and life history stages in plant and animal populations. Gain insights into predicting population changes through mathematical models and matrix algebra.

E N D
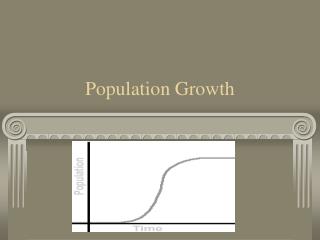
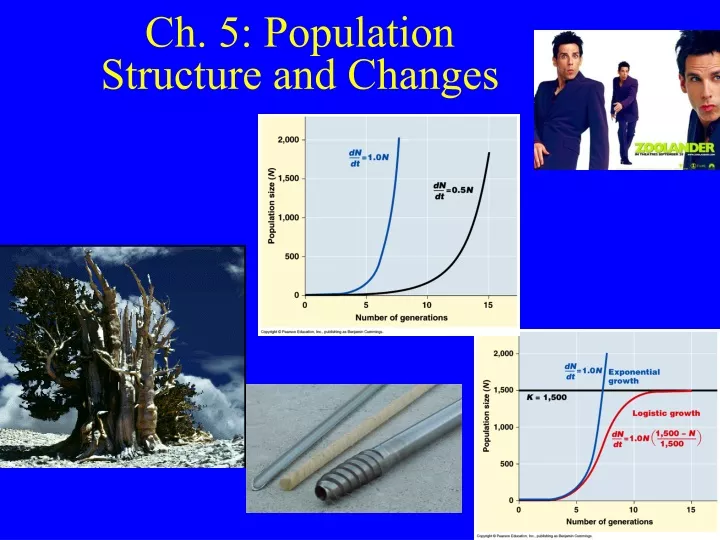
Population Models • 2) Continuous time models • dN/dt=Nrmax Ideal conditions…
Population Models • 2) Continuous time models • Limiting conditions • Logistic growth.
Population Models • 2) Continuous time models • dN/dt=Nrmax (K-N)/K • N small: (K-N)/K almost 1 • N near K: (K-N)/K very small
Population Models • Plant Point 1: K based on density • Animals: most individuals have certain size • Plants: high modular growth/plasticity • Crowding capacity: combine density with biomass per individual.
Population Models • Plant Point 2: “Law” of constant yield • Yield same Great Phenotypic Plasticity
Population Models • 3) Discrete-time period models (complex): life tables BIOL 3060 Cemetery lab
Population Models • Types: • Cohort life table: follow • Static life table: assume
Oldest known tree • Bristlecone Pine (Pinus longaeva). High mtns. How age?
Oldest known tree • Increment borer: extract
Oldest known tree • Oldest was 4,950 yr (NV mountains)
Oldest known tree • Now oldest (“Methuselah”) 4,767 yr.
Population Models • Survivorship (lx): proportion orig.
Population Models • Survivorship curves: mortality • Type I: Annual plants. • Type II: • Type III: Perennial Note log scale on Y axis!
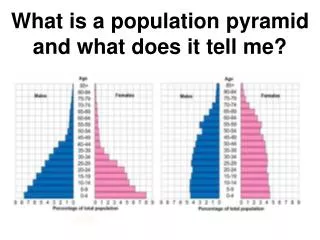
Age distributions • Predictive? • Ex, pine/hardwood succession
Age distributions • Often, stable pop’n L-shaped • Ex, red spruce (Picea rubens)
Age distributions • Some species: episodic establishment • Sporadic Jack…
Age/stage distributions • Serotinous cones (closed-cone pine) • Seed
Population Models • 3) Model: life table info + fecundity info • Fecundity: age- • Survivorship & fecundity give net reproductive rate (R0): • R0 = ∑ lx bx
Population Models • R0 = ∑ lx bx • Ex: • Age Survivorship (lx) Fecundity (bx) Reproduction • 0-1 1.0 0 • 1-2 0.2 3 • 2-3 0.1 5 • 3-4 0 0 • R0 = 1.1
Population Models • R0 >1, • R0 =1, • R0 <1,
Population Models • 4) Transition matrix models • Life history stages + matrix algebra 1L SL 3L Trillium! Fig. 5.6 Matrix..
Population Models • Matrix algebra • Matrix: numbers rows/columns
Population Models • Ex: Column matrix (vector) = pop’n status: population vector • Life history stages: s=seeds, r=rosettes, f=flowering 140 16 10 # seeds # rosettes # flowering Lab 1: who am I? Rosette forming perennial
Population Models • Transition matrix: probability transition
Population Models • Ex: teasel (Dipsacus sylvaticus) • Perennial pasture/roadside weed.
Population Models • Transition matrix: teasel (Dipsacus sylvaticus) Note columns don’t always sum to 1.0: accounts for mortality
Population Models • Model: pop’n vector X transition matrix • New matrix: pop’n structure next time
Population Models • Ex: 3 stages. Seed, rosette, flowering • Pop’n vector 140 20 10 # seeds # rosettes # flowering
Population Models • Ex: 3 stages. Seed, rosette, flowering • Transition matrix year 1 seed rosette flowering 20 0.2 0.1 seed 0.5 0.2 0 0 0.2 0.5 year 2 rosette flowering Note: columns not summing to 1.0 includes mortality