Download
1 / 14
140 likes | 214 Views
Learn how to effectively summarize and describe a large number of measurements using visual techniques, such as frequency tables, frequency polygons, histograms, pie charts, and bar charts. Understand different shapes of distributions like unimodal, multimodal, rectangular, symmetrical, and skewed distributions.

E N D
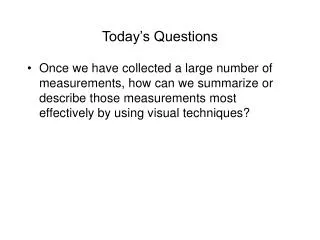
Today’s Questions • Once we have collected a large number of measurements, how can we summarize or describe those measurements most effectively by using visual techniques?
First Example How stressed have you been in the last 2 ½ weeks? Scale: 0 (not at all) to 10 (as stressed as possible) 4 7 7 7 8 8 7 8 9 4 7 3 6 9 10 5 7 10 6 8 7 8 7 8 7 4 5 10 10 0 9 8 3 7 9 7 9 5 8 5 0 4 6 6 7 5 3 2 8 5 10 9 10 6 4 8 8 8 4 8 7 3 7 8 8 8 7 9 7 5 6 3 4 8 7 5 7 3 3 6 5 7 5 7 8 8 7 10 5 4 3 7 6 3 9 7 8 5 7 9 9 3 1 8 6 6 4 8 5 10 4 8 10 5 5 4 9 4 7 7 7 6 6 4 4 4 9 7 10 4 7 5 10 7 9 2 7 5 9 10 3 7 2 5 9 8 10 10 6 8 3 from Aron & Aron’s text, Statistics for Psychology
Frequency Tables • A frequency table shows how often each value of the variable occurs
Frequency Polygon • A visual representation of information contained in a frequency table • Align all possible values on the bottom of the graph (the x-axis) • On the vertical line (the y-axis), place a point denoting the frequency of scores for each value • Connect the lines • (Typically add an extra value above and below the actual range of values)
Histograms • Another way of visually representing information contained in a frequency table • Histograms are kind of like bar charts; bars are used instead of connected points • The bars typically cover “intervals” of values. The first bar here covers scores > 0 and < 1.
Pie Charts and Nominal Data • Pie charts are commonly used to represent the frequency of scores for nominal data • Here, frequency of referents in a letter written by a subject in a psychological study. • 70% of the pronouns are in reference to the writer; 10% are in reference to the person being written to.
Barcharts and Nominal Data • Barcharts are sometimes used to represent the frequency of scores for nominal data • Here, frequency is expressed as a percentage of the total number of males and females • (78% and 68%)
Shapes of Distributions • These representational aides all describe frequency distributions: the way score frequencies are distributed with respect to the values of the variable • Distributions can take on a number of shapes or forms
Unimodal Distributions • The mode of a distribution refers to the most frequently occurring score • In a unimodal distribution, one score occurs much more frequently than others
Multimodal Distributions • In multimodal distributions, more than one mode exists (or approximately so) • In a bimodal distribution, two modes exist
Rectangular or Uniform Distributions • In a uniform distribution, all values are observed equally often
Symmetrical and Skewed Distributions • A symmetrical distribution is balanced: if we cut it in half, the two sides would be mirror images of one another • normal distribution: a particular kind of distribution that resembles a bell (bell-shaped distribution)
Skewed Distributions • A skewed distribution is unbalanced; there may be a cluster of scores piling on one end of the scale
Skew negative skew positive skew reasons for skew?