Download
1 / 2
20 likes | 223 Views
Twinning Studies via Experiments and Theory Huseyin Sehitoglu, University of Illinois, DMR 0803270.

E N D
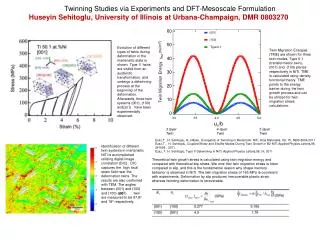
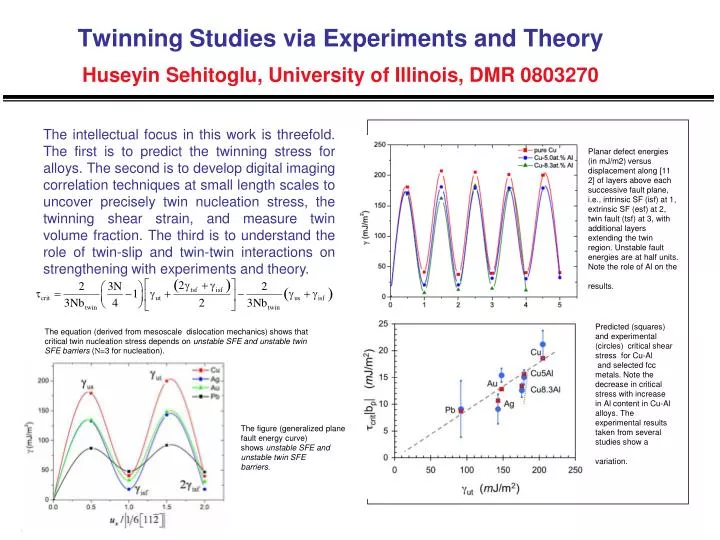
Twinning Studies via Experiments and TheoryHuseyin Sehitoglu, University of Illinois, DMR 0803270 The intellectual focus in this work is threefold. The first is to predict the twinning stress for alloys. The second is to develop digital imaging correlation techniques at small length scales to uncover precisely twin nucleation stress, the twinning shear strain, and measure twin volume fraction. The third is to understand the role of twin-slip and twin-twin interactions on strengthening with experiments and theory. Planar defect energies (in mJ/m2) versus displacement along [11 2] of layers above each successive fault plane, i.e., intrinsic SF (isf) at 1, extrinsic SF (esf) at 2, twin fault (tsf) at 3, with additional layers extending the twin region. Unstable fault energies are at half units. Note the role of Al on the results. Predicted (squares) and experimental (circles) critical shear stress for Cu-Al and selected fcc metals. Note the decrease in critical stress with increase in Al content in Cu-Al alloys. The experimental results taken from several studies show a variation. The equation (derived from mesoscale dislocation mechanics) shows that critical twin nucleation stress depends on unstable SFE and unstable twin SFE barriers (N=3 for nucleation). The figure (generalized plane fault energy curve) shows unstable SFE and unstable twin SFE barriers.
[111] Matrix Matrix Twin a/6 [-2 1 1](111) Twin a/6 [3 0 1]](010) a/3 [0 1 1] (1 0 0) Twin boundary Matrix a/6 [2 1 1] (1 -1 -1) Matrix a/6 [ 112] (-1 -1 1) Twinning Studies via Experiments and TheoryHuseyin Sehitoglu, University of Illinois, DMR 0803270 [010] The broad impact of the work is to design new alloys with prediction of mechanical properties without lengthy experimental trials, and develop a materials design methodology that is widely applicable to various industries. For example, our focus includes Fe-Mn fcc steels that are utilized in special rail applications (for example in crossings). We are organizing an international symposium in Istanbul, Turkey where phase transformation and twinning studies will be highlighted. We study the energetics of twin-slip interactions and twin growth under loading in different directions. The incident slip a/6[112] separates into an a/6[-2 1 1] partial and an a/6[301] stair rod dislocation. Schmid factor of a/6 [-211](111) orientation is 0.231 and in a/6[301](010) orientation is 0. The twin grows by one atomic layer as partial traverses across the interface. The incident slip a/6[2 1 1] separates into an a/6[-2 1 1] partial and an a/3[011] full dislocation. Schmid factor of a/6 [-211](111) orientation is 0 and in a/3[011](100) orientation is 0.477.Energy barrier for slip in this case is expected to lead to significant strain hardening. a/6 [-2 1 1] (1 1 1) Twin boundary Precise experimental micro- and macro-measurements of strain hardening (slope of stress-strain curve) utilizing digital image correlation.Evolution of the strain hardening rate in {111} Fe-Mn crystals subjected to tension for the specimen with twin-twin and twin-slip intersections (blue curve), and without intersections (red curve). The dotted red line represents the maximum strain hardening rate found in a 200 micron2 region (red dotted box), and the dotted blue line represents the minimum strain hardening value obtained in a 200 micron2 region at the center primary twin-band (black dotted box).The strain fields are scaled 0-5% to show the details. Generalized plane fault energy curve along the <110> direction in {100} plane for Cu.