Download
1 / 23
230 likes | 374 Views
CLAVIER: region of interest-Bulgaria, Hungary, Romania. Climate ChAnge and Variability: Impact on Central and Eastern EuRope. Coordination: Daniela Jacob, Max-Planck-Institute for Meteorology, Germany. CLAVIER participants. 1. Max-Planck-Institute for Meteorology Hamburg,. MPI-M. Germany.

E N D
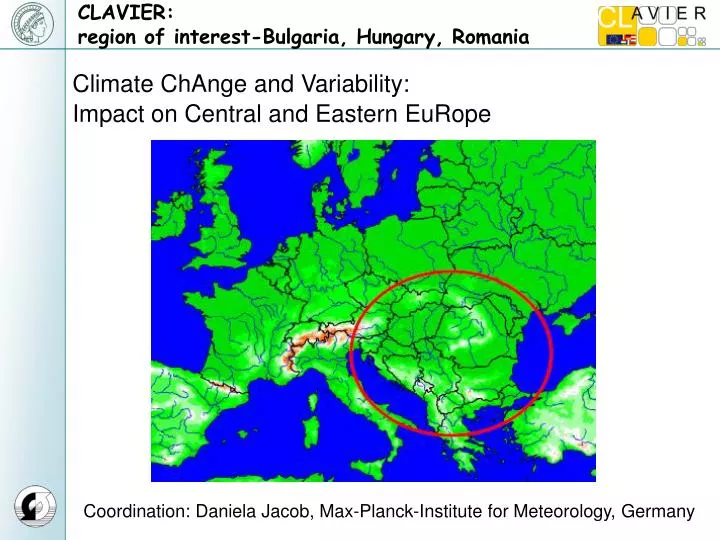
CLAVIER: region of interest-Bulgaria, Hungary, Romania Climate ChAnge and Variability: Impact on Central and Eastern EuRope Coordination: Daniela Jacob, Max-Planck-Institute for Meteorology, Germany
CLAVIER participants 1 Max-Planck-Institute for Meteorology Hamburg, MPI-M Germany 2 Hungarian Meteorological Service, Budapest OMSZ Hungary 3 University of Graz/Wegener Centre WegCenter Austria 4 Institut Pierre Simon Laplace, Paris CNRS France 5 Joanneum Research Graz JR Austria 6 VITUKI Environmental Protection and Water Management Institute, Budapest VITUKI Hungary 7 Budapest University of Technology and Economics, Faculty of Civil Engineering, Department of Hydraulic and Water Resources Engineering, Budapest BME Hungary 8 Env-In-Cent Consulting Ltd., Budapest EiC Hungary 9 National Institute of Meteorology and Hydrology, Sofia NIMH Bulgaria 10 University of National and World Economy, Sofia UNWE Bulgaria 11 National Institute of Hydrology and Water Management, Bucharest INHGA Romania 12 University of Cluj UBB Romania 13 The Institute of Geography of the Romanian Academy IG Romania
CLAVIER goals • Investigation of ongoing and future climate changes and their associated uncertainties in Central and Eastern European Countries (CEEC) until 2050 • Analyses of possible impact of climate changes in CEEC on weather pattern and extremes, air pollution, human health, natural ecosystems, forestry, agriculture and infrastructure as well as water resources • Evaluation of the economic impacts of climate changes on CEEC economies, concentrating on four economic sectors, which are agriculture, tourism, energy supply and the public sector
Observed changes in means and extremes
Annual Average 2m temperature anomaly (oC) of the period 1961–1970 compared to the period 1961–2000 Average 2m temperature anomaly (oC) of the period 1971–1980 compared to the period 1961–2000 Average 2m temperature anomaly (oC) of the period 1981–1990 compared to the period 1961–2000 Average 2m temperature anomaly (oC) of the period 1991–2000 compared to the period 1961–2000 2m temperature anomaly for 10 years with respect to the 40 year mean • Annual: negative anomaly for the large part of Europe for the first two decades, then increasing positive anomaly
Winter Average 2m temperature anomaly (oC) of the period 1961–1970 compared to the period 1961–2000 for winter Average 2m temperature anomaly (oC) of the period 1971–1980 compared to the period 1961–2000 for winter Average 2m temperature anomaly (oC) of the period 1981–1990 compared to the period 1961–2000 for winter Average 2m temperature anomaly (oC) of the period 1991–2000 compared to the period 1961–2000 for winter 2m temperature anomaly for 10 years with respect to the 40 year mean • Winter: the most significant changes, the highest for Iceland and Northern Europe
Summer Average 2m temperature anomaly (oC) of the period 1961–1970 compared to the period 1961–2000 for summer Average 2m temperature anomaly (oC) of the period 1971–1980 compared to the period 1961–2000 for summer Average 2m temperature anomaly (oC) of the period 1981–1990 compared to the period 1961–2000 for summer Average 2m temperature anomaly (oC) of the period 1991–2000 compared to the period 1961–2000 for summer 2m temperature anomaly for 10 years with respect to the 40 year mean • Summer: similar, but not so drastic tendency
Slight increase of the daily mean temperature for the last decade Annual Anomaly of daily mean temperature of the period 1991–2000 compared to the average calculated for the periods 1971–1980, 1991–2000 Anomaly of daily mean temperature
Summer Anomaly of daily mean temperature of the period 1991–2000 compared to the average calculated for the periods 1971–1980, 1991–2000 for summer Anomaly of daily mean temperature The highest increase is in summer (up to 1.5°)
Budapest Frequency distribution of the daily maximum wind gust Periods: 1971–1980 and 1991–2000. Location: Budapest Increase of the heavy and stormy wind gust Daily maximum wind gust
Possible future changes until 2050 using IPCC scenario A1B and the modelling chain: (ECHAM5/MPI-OM driving REMO) More calculations and analyses will be done within the project
Temperature changes (A1B), 2050 Winter Spring ºC Summer Autumn (ECHAM5/MPI-OM driving REMO)
Precipitation changes (A1B), 2050 Winter Spring % Summer Autumn (ECHAM5/MPI-OM driving REMO)
Case studies CS1: Grassland (Hortobágy) CS2: Roads CS3: Buildings (roof) CS4: Heat waves CS5: Ragweed
Selected case studies • for economic investigations on: • public sector (natural catastrophes, risk transfer, national level) • agriculture (BUL: Severoiztochen,RO: Nord Vest,) • energy (BUL: Vratsa (Kozloduj), Pleven (Belene),HU: Gyor-Moson- Sopron,RO: Arges (Vidraru)) • tourism (BUL: Blagoevgrad (winter), HU: Vezprem (summer), RO: Prahova/Braşov (winter), Constanţa (summer))
The CLAVIER-Region WP4 – ECONOMY: Economic Vulnerability of CEE Societies and Economic Impact Assessment
CLAVIER Hotspot areas : Romania 1. North-West Development Region; (NUTS 2); Agriculture 2. Arges Basin; Vidraru Reservoir; Hydroelectric Power Plant; 3. Prahova Valley & Poiana Brasov, Southern Carpathians; Tourism 4. Bend Subcarpathians; Natural hazards (erosion, landslides) 5. Black Sea Coast, Constanta County; Tourism
The meteorological station at the Vitosha mountain top „Cherni Vrah“ of the Bulgarian National Institute of Meteorology and Hydrology Thank you!