Download
1 / 8
80 likes | 186 Views
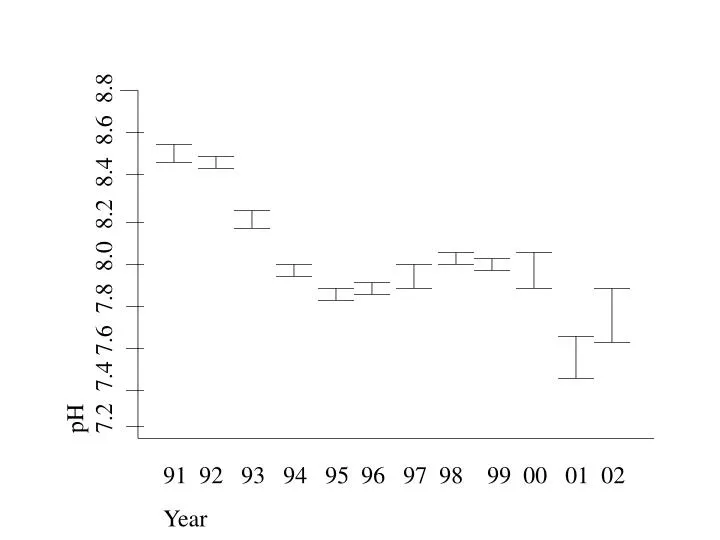
Fig 1. Surface pH against time. pH 7.2 7.4 7.6 7.8 8.0 8.2 8.4 8.6 8.8. 92 93 94 95 96 97 98 99 00 01 02 Year. Figure 2. Conductivity of soil water against time. The declining phase is modelled by the function y = 4.69*exp(-0.29*(year-1993))

E N D
Fig 1. Surface pH against time. pH 7.2 7.4 7.6 7.8 8.0 8.2 8.4 8.6 8.8 • 92 93 94 95 96 97 98 99 00 01 02 • Year
Figure 2. Conductivity of soil water against time. The declining phase is modelled by the function y = 4.69*exp(-0.29*(year-1993)) hence T½ = 2.4 years Figure 2: Conductivity of soil water against time Conductivity, mS cm-1 0 2 4 6 8 10 12 • 92 93 94 95 96 97 98 99 00 01 02 • Year
Figure 3: Soil mass loss on ignition vs time % Loss on ignition 0 5 10 15 20 • 92 93 94 96 97 98 00 01 02 • Year
Figure 4. Soil surface pH and organic matter as a function of fertiliser treatment. b c pH 7.9 8.0 8.1 8.2 8.3 10 11 12 13 %LOI ab b a a None Chemical Organic Fertiliser treatment
Figure 5: Soil nitrate against distance from site centre at the final harvest in 2002 y = 0.19 + 0.016*X r = 0.33** NO3, mg 100g-1 0 0.25 0.5 0.75 1.0 c c 0 5 10 15 distance from centre of site, m
Fig 6: % Plant cover against time as a function of initial fertilizer treatment Mean % cover, bars show 1s.e. 0 20 40 60 80 100 Control Chemical Manure 91 92 93 94 95 96 97 98 99 00 01 02 Year
Key 91-94 95-98 99-02 Ca Figure 7. DCA ordination of the floral data Lc Fa Di Vt Ap -100 0 100 200 300 400 Cr Bg 2nd DCA axis (Eigenvalue = 0.265) Sm c Pm Fh Mo Lc Vm Lg Hl Dc Vc Hr -100 0 100 200 300 400 500 1st DCA axis (Eigenvalue = 0.599)