Download
1 / 20
200 likes | 239 Views
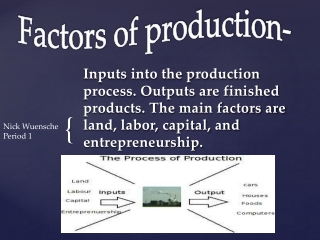
Delve into the essential factors of production, such as land, labor, capital, and entrepreneurship. Learn about opportunity costs and the production possibilities curve. Gain insights into how specialization can enhance efficiency in economic activities.

E N D
Factors of Production What went into making this?
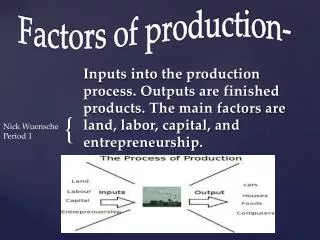
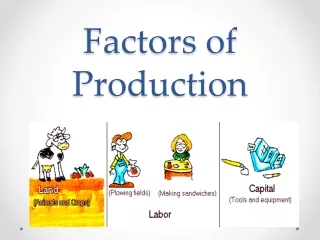
What went into this? Rubber (from Malaysia) machines metal Someone who put all of this together. wood graphite
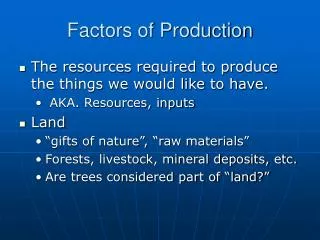
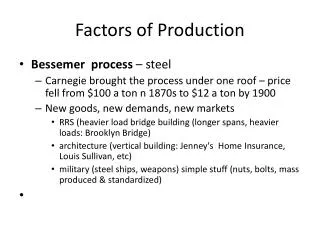
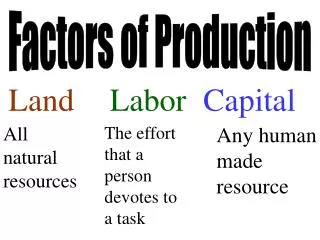
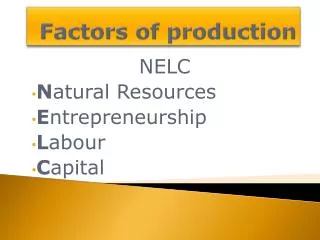
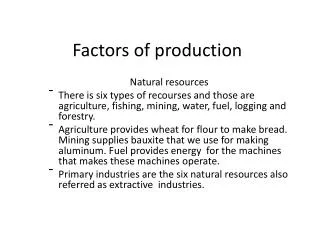
4 Categories of Productive Resources (Factors of Production) LANDLABOR CAPITALENTREPRENUERSHIP • Natural, renewable resources • wood, rubber, graphite, land, animals • Human resources, people • MENTAL and PHYSICAL • A produced good used in the production of another good • Machines, computers, buildings, etc • The person or group responsible for putting the other 3 together to produce something
Opportunity Costs • OPPORTUNITY COSTS: the value of the NEXT BEST alternative given up when a choice is made • NEXT BEST is key, the cost is not everything you give up. • Opportunity cost is not always money
Opportunity Costs Examples Timothy really wants BOTH goods: $3,500 $1,000
Opportunity Costs Examples He decides to spend his money on: $3,500 What was the price he paid? What was his opportunity cost?
Opportunity Costs • You have $100 to spend at the mall, rank the following in the order (1, 2, 3) you would purchase them. DVD set of a TV Show($60) New outfit ($85) New pair of shoes ($65)
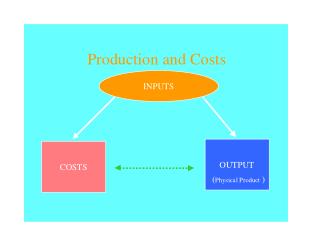
PPC • a graph that shows the trade-off between two production options • A visual representation of OPPORTUNITY COSTS • 2 Assumptions: • The company/country is ONLY producing the two goods on the graph • The company/country desires to use ALL of their resources
PPC – an example • Suppose a country makes Pencils and Pens. • If they devoted ALL of their resources to pencils, they could make 500 a day • …..to pens, they could make 300 a day 500 300
PPC – an example The country/business can produce anywhere on the line when they use ALL of their resources 500 Pencils Pens 300
PPC – an example If the country is producing ONLY pencils, and they want pens, they have to give up pencils. 500 450 Pencils The more pens they want….. 200 Pens 125 200 300
PPC – an example Y At point X, the country or business is producing below its possibilities and is INEFFICIENT 500 Pencils X At point Y, the country or business is producing beyond its possibilities and is NON-SUSTAINABLE. 200 Pens 75 300
After graphing, answer these questions: • Assume the country is currently producing 180 of good A and 25 of Good B. If the country wants to make 75 of Good B, how many of good A must they give up? • If the country was producing 150 of Good A and 30 of Good B, what could you conclude about the country’s economy?
What BEST explains the shift of theproduction possibilities curve fromB1 to B2? A improvements in agricultural technology B inflationary increases in process C higher costs of producing corn D higher costs of producing wheat
Answer to 2 • 2. Answer: A Standard: Investment and economic growth • An outward expansion of a production possibilities frontier means greater productivity. One way greater productivity can be achieved is by improving technology.
Question 3 3 Alex and Dylan mow and trim lawns. Currently, each man mows and trims a lawn by himself, but the process takes a long time. They would MOST likely improve their efficiency if A Alex and Dylan mow a lawn and then trim it together B Alex mows a lawn while Dylan trims the same lawn C Alex trims Dylan’s lawn while Dylan trims Alex’s lawn D Alex and Dylan reduce the number of lawns they mow and trim
Answer 3 3. Answer: B Standard: Benefits of specialization One of the best ways to improve efficiency is to specialize, which means each person in a production process concentrates on a specific task. Choice A would still require each man to mow and trim, while choice C simply changes the lawn each man is trimming. Choice D, on the other hand, reduces the total number of lawns they mow but does not improve the efficiency with which they complete their task. Only choice B would be a specialization of labor. In this case, Dylan now does one task in the production process (trims) while Alex does another task (mows). According to economic theory, this specialization will make each man better at his respective task and reduce the time it takes to change from one task to another, thereby increasing their overall efficiency.