Download
1 / 1
40 likes | 217 Views
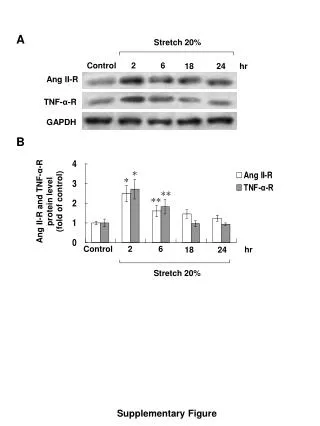
Supplemental Figure 1 Komori H. et al. A. B. (mg/mL). 0. 0.1. 0.25. 0.5. 1.0. 2.0. (hr). 0. 6. 12. 24. 36. 48. CD163. CD163. b -actin. b -actin. CD163/18S rRNA (THP-1). CD163/18S rRNA (THP-1). 7. 7. 6. 6. 5. 5. 4. 4. Relative quantity of CD163 mRNA.

E N D
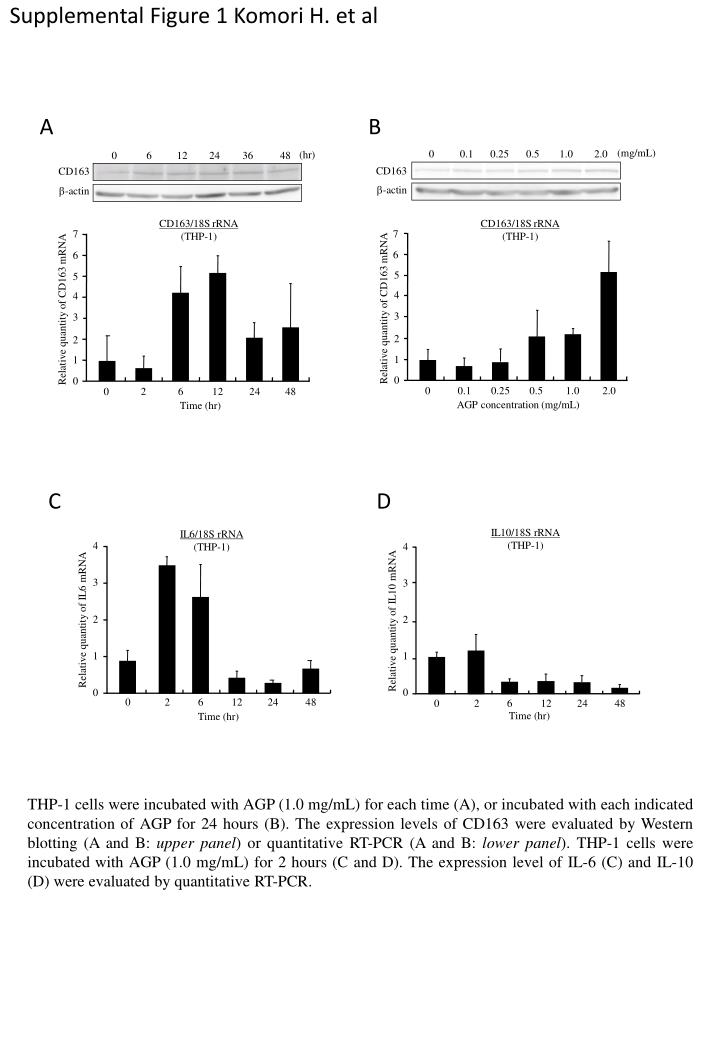
Supplemental Figure 1 Komori H. et al A B (mg/mL) 0 0.1 0.25 0.5 1.0 2.0 (hr) 0 6 12 24 36 48 CD163 CD163 b-actin b-actin CD163/18S rRNA (THP-1) CD163/18S rRNA (THP-1) 7 7 6 6 5 5 4 4 Relative quantity of CD163 mRNA Relative quantity of CD163 mRNA 3 3 2 2 1 1 0 0 0 0.1 0.25 0.5 1.0 2.0 0 2 6 12 24 48 AGP concentration (mg/mL) Time (hr) C D IL10/18S rRNA (THP-1) IL6/18S rRNA (THP-1) 4 4 3 3 2 2 Relative quantity of IL6 mRNA Relative quantity of IL10 mRNA 1 1 0 0 0 2 6 12 24 48 0 2 6 12 24 48 Time (hr) Time (hr) THP-1 cells were incubated with AGP (1.0 mg/mL) for each time (A), or incubated with each indicated concentration of AGP for 24 hours (B). The expression levels of CD163 were evaluated by Western blotting (A and B: upper panel) or quantitative RT-PCR (A and B: lower panel). THP-1 cells were incubated with AGP (1.0 mg/mL) for 2 hours (C and D). The expression level of IL-6 (C) and IL-10 (D) were evaluated by quantitative RT-PCR.