Download
1 / 42
420 likes | 447 Views
Explore the interaction of gas in peculiar galaxies, as seen in the Toomre sequence of ongoing mergers. Learn about morphologies and kinematics explained by galaxy interactions and neutral hydrogen fuel for star formation. Discover visualization techniques for understanding 3-dimensional spectral line data of galaxies.

E N D
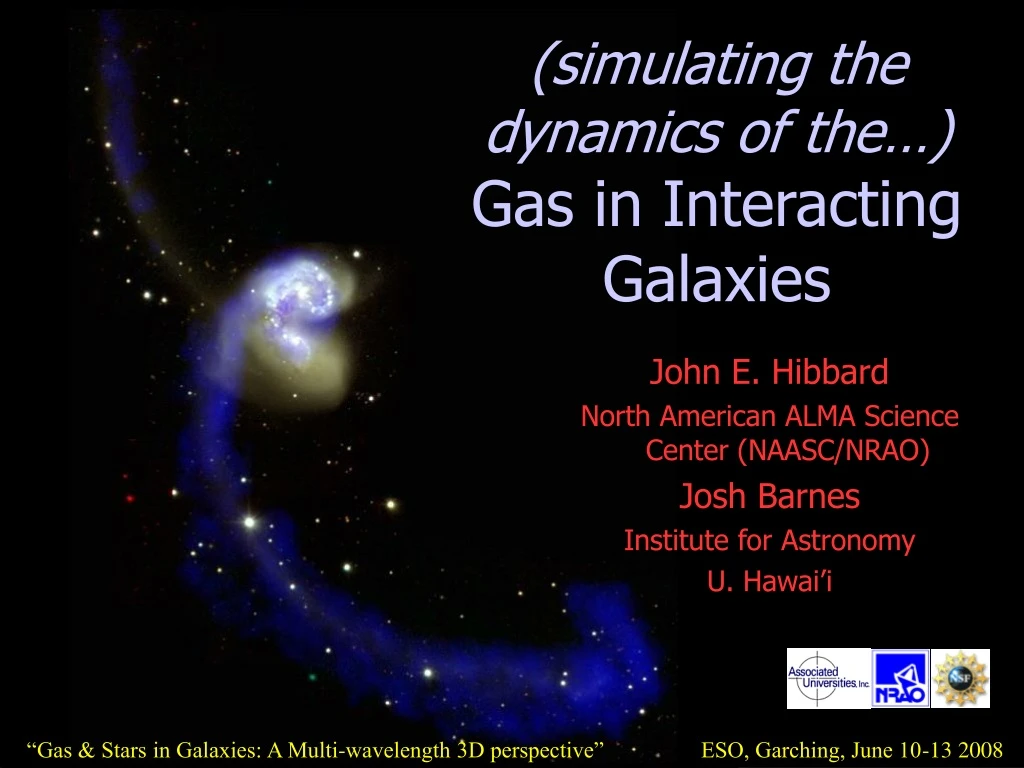
(simulating the dynamics of the…)Gas in Interacting Galaxies John E. Hibbard North American ALMA Science Center (NAASC/NRAO) Josh Barnes Institute for Astronomy U. Hawai’i “Gas & Stars in Galaxies: A Multi-wavelength 3D perspective” ESO, Garching, June 10-13 2008
Peculiar Galaxies: dynamically unrelaxed (non-equilibrium) forms Toomre Sequence of On-going Mergers (Toomre 1977) from Arp Atlas of Peculiar Galaxies (Arp 1966)
5%-10% of population in local universe • In UGC, ~600 out of 9000 galaxies (~7%) with morphological descriptions including: disrupted, distorted, disturbed, interacting, eruptive, peculiar, bridge, loop, plume, tail, jet, streamer, connected (note, some are multiple systems, but not all need be interacting) • Total fraction that went through a peculiar phase = %peculiar * T/tpeculiar
Morphologies (& Kinematics!) can be explained by galaxy-galaxy interactions Seminal Paper (1369 citations): Toomre & Toomre 1972
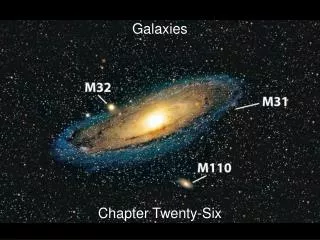
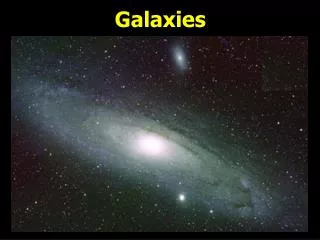
Neutral Hydrogen in Galaxies • B/W=optical image of NGC 6946 from Digital Sky Survey • Blue=Westerbork Synthesis Radio Telescope 21 cm image of Neutral Hydrogen (Boomsma 2007 PhD Thesis) • Neutral Hydrogen is the raw fuel for all star formation • Hydrogen usually much more extended than stars
Dynamically cold & extended HI responds strongly to the tidal forces M81/M82/NGC3077 VLA 12-pointing mosaic Yun et al. 1994
HI kinematics strongly affirmed interaction hypothesis HI contours on DSS: van der Hulst, 1977, PhD. Thesis
For illustrations, You must choose between many 2-dimensional projections • 1-D Slices along velocity axis = line profiles • 2-D Slices along velocity axis = channel maps • Slices along spatial dimension = position velocity profiles • Integration along the velocity axis = moment maps
“Channel Maps”spatial distribution of line flux at each successive velocity setting
Moment Maps Zeroth Moment Integrated flux First Moment mean velocity Second Moment velocity dispersion
Position-Velocity Profiles -250 km/s +250 km/s • Slice or Sum the line emission over one of the two spatial dimensions, and plot against the remaining spatial dimension and velocity • Susceptible to projection effects -250 km/s +250 km/s
Rotating datacubes gives complete picture of data, noise, and remaining systematic effects Karma “xray” package & Oosterloo “cube2mpeg”
Rotations emphasize kinematic continuity and help separate out projection effects 3-D rendering program “xray” in the Karma visualization package & “cube2mpeg” http://www.atnf.csiro.au/computing/software/visualisation/ http://www.atnf.csiro.au/computing/software/karma/ Gooch, R.E., 1996, "Karma: a Visualisation Test-Bed", in Astronomical Data Analysis Software and Systems V, ASP Conf. Series vol. 101, ed. G.H. Jacoby & J. Barnes, ASP, San Francisco, p.80-83, ISSN 1080-7926
Rotations emphasize kinematic continuity and help separate out projection effects • 3-D rendering program “xray” in the Karma visualization package & “cube2mpeg” • http://www.atnf.csiro.au/computing/software/visualisation/ • http://www.atnf.csiro.au/computing/software/karma/ • Gooch, R.E., 1996, "Karma: a Visualisation Test-Bed", in Astronomical Data Analysis Software and Systems V, ASP Conf. Series vol. 101, ed. G.H. Jacoby & J. Barnes, ASP, San Francisco, p.80-83, ISSN 1080-7926
3rd dimension allows us to construct more accurate numerical models “Identikit” Mk 0 Hibbard 1995
A few dozen model “matches” to interacting galaxies have been published • Only a handful “match” spatially resolved kinematics
Model Matching: the Hard Way • Build two model galaxies (B+D+H; Barnes 1988; Barnes & Hernquist 1996) • Select 1 encounter geometry; run
Model Matching: the Hard Way • Run model • Match • Build another & run • Compare; decide how to change params • Etc… • Takes ~50 trials to get decent fit to simple forms (N7252 Hibbard & Mihos 1995; N4676 Hibbard & Barnes 1997)
Identikit Mk 1: simulate all disk geometries • Populate live halo with swarm of test particles on circular orbits • Display only test particles with initial angular momentum closely aligned with desired disks
Test: generate 36 random BDH simulation & match • generate 36 random BDH self-consistent N-body simulations • Read into Identikit & Match • Subjectively grade fit: good, fair, poor • Check fit vs. actual parameters Barnes & Hibbard 2008 submitted
Disk orientation parameters Disk orientation • All fits: 25deg • Good fits: 10deg Viewing angles • All fits: 25deg • Good fits: 8deg Viewing Angles Red=“good” fits Black=“fair” fits Cyan=“poor” fits
Time since pericenter Time since pericenter • All fits: 14% • Good fits: 9% Pericentric separation • All fits: 25% • Good fits: 15% Pericentric Separation Red=“good” fits Black=“fair” fits Cyan=“poor” fits
Linear Scale Factor Linear scale factor • All fits: 16% • Good fits: 10% Velocity scale factor* • All fits: 15% • Good fits: 5% Velocity Scale Factor Red=“good” fits Black=“fair” fits Cyan=“poor” fits
Identikit interactive modeling tool • Can match models fairly well • Models judged as good fits are better able to recover true parameters • Perhaps more importantly, models that do not recover true parameters are judged as fair/poor fits (no false positives) • Caveat: simulated “real” systems had the same radial mass profile as Identikit models
Tools like Identikit 1 can greatly speed model matching process • Hibbard, 1993-1997: • Identikit 0 for N7252, N4676, N4038 • ~50 simulations per system, ~2mo each • Barnes, 2008: Identikit 1: • matched 36 systems in ~1 mo
Why bother matching? • So you know some angles and scale factors, so what?
Time Evolution http://www.ifa.hawaii.edu/~barnes/pressrel/antfacts/ 1 million particle simulation of best fitting parameters System made first pass ~220 Myr ago; will merge in ~40 Myr
3-dimensional structure of The Antennae http://www.ifa.hawaii.edu/~barnes/pressrel/antfacts/
Why is base of northern tail devoid of HI, while southern tail is gas rich? - Gas in northern tail has direct view of young SSCs with ionizing radiation - Gas in southern tail does notSimulation confirms that 3-D geometry is suitable for this interpretation
Next Generations telescopes require novel visualization approaches • 2009: EVLA widar correlator • 2:1 bandwidth ratios • 16k-4M channels! • 2012: ALMA • 10 bands • 4096 channels per IF • Hundreds of atomic & molecular transitions in the mm-submm IN THE SAME DATA CUBES Both: All spectral mode, all the time
Imaging Chemistry in Galaxies IC 342 — Owens Valley Millimeter Array Meier & Turner 2005 PC Axis 1: Density-weighted mean column density PC Axis 2: Shock tracers vs PDR molecules C2H: PDR Methanol, HCNO: shocks Gas density: CO, N2H+, HCN
Detected interstellar molecules H2 HD H3+ H2D+ CH CH+ C2 CH2 C2H *C3 CH3 C2H2 C3H(lin) c-C3H *CH4 C4 c-C3H2 H2CCC(lin) C4H *C5 *C2H4 C5H H2C4(lin) *HC4H CH3C2H C6H *HC6H H2C6 *C7H CH3C4H C8H *C6H6 OH CO CO+ H2O HCO HCO+ HOC+ C2O CO2 H3O+ HOCO+ H2CO C3O CH2CO HCOOH H2COH+ CH3OH CH2CHO CH2CHOH CH2CHCHO HC2CHO C5O CH3CHO c-C2H4O CH3OCHO CH2OHCHO CH3COOH CH3OCH3 CH3CH2OH CH3CH2CHO (CH3)2CO HOCH2CH2OH C2H5OCH3 (CH2OH)2CO NH CN N2 NH2 HCN HNC N2H+ NH3 HCNH+ H2CN HCCN C3N CH2CN CH2NH HC2CN HC2NC NH2CN C3NH CH3CN CH3NC HC3NH+ *HC4N C5N CH3NH2 CH2CHCN HC5N CH3C3N CH3CH2CN HC7N CH3C5N? HC9N HC11N NO HNO N2O HNCO NH2CHO SH CS SO SO+ NS SiH *SiC SiN SiO SiS HCl *NaCl *AlCl *KCl HF *AlF *CP PN H2S C2S SO2 OCS HCS+ c-SiC2 *SiCN *SiNC *NaCN *MgCN *MgNC *AlNC H2CS HNCS C3S c-SiC3 *SiH4 *SiC4 CH3SH C5S FeO DEMIRM
Why is base of northern tail devoid of HI, while southern tail is gas rich? - gas in northern tail has direct view of young SSCs with ionizing radiation Young star clusters - Gas in southern tail does notSimulation confirms that 3-D geometry is suitable for this interpretation