Download
1 / 19
190 likes | 206 Views
This presentation discusses the use of probabilistic reasoning and Bayesian inference for modeling uncertainty in unreliable data. Topics include modeling probability distributions, clustering data using expectation maximization, and a simple example.

E N D
Probabilistic Reasoning for Modeling Unreliable Data Ron Tal York University
Agenda • Modeling Uncertainty • Bayesian Reasoning • Modeling Probability Distributions • Clustering Data Using Expectation Maximization • Simple Example • Discussion
Modeling Uncertainty • Why is it necessary? • The only certainty in this world is uncertainty • Often we cannot afford or are not capable of explicitly enumerating all variables absolutely • Sometimes uncertainty is caused by a limit of the reliability of the technology • Making decisions with unreliable data
Modeling Uncertainty (cont.) • Three competing paradigms: • Non-monotonous Calculus • Fuzzy Logic • Probability Theory • Since we cannot construct a deterministic solution to many problems, we model sources of uncertainty as probability distribution
Bayesian Reasoning • At the core of probabilistic frameworks is Bayesian Inference • Let’s define a few concepts: • - The probability of witnessing evidence E according to hypothesis H • - The probability of hypothesis H given the evidence E • - Probability of Hprior to observing E • -
Bayesian Reasoning: Bayes’ theorem • States that: • Our life becomes simpler Easy to determine! We already know! We don’t always care! Hard to Determine!
Bayesian Reasoning: Bayes’ theorem • If we prefer, it can also be written as The joint probability
Maximum Likelihood • Represents support for a hypothesis in terms of the probabilities of all observations: • Lets us estimate best parameters of a model!
Maximum Likelihood (cont.) • To determine parameters of a model, we maximize the negative log likelihood:
Modeling Probability Distributions • There are many popular ways to represent probabilities • Perhaps the most popular is the Normal or Gaussian Distribution
Modeling Probability Distributions (cont.) • Why? • Frequently occurs in nature • Nice mathematical properties • Maximum Likelihood Estimator is simple Least-Squares
Modeling Probability Distributions (cont.) • Mixture of Gaussians • Provides good approximation of complex distributions • Mathematically treated as a sum of Gaussians • Flexible • Simple Least-Squares won’t do
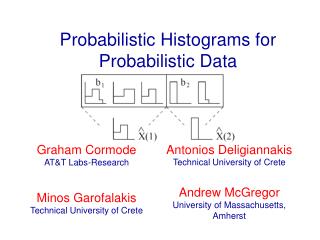
Modeling Probability Distributions (cont.) • Non-Parametric • Usually a histogram • Simple to use • For some cases parametric models won’t do • Unflexible
Clustering Data with EM • EM is an iterative algorithm for parameter fitting • Simple premise • Make a guess of the parameters • Find new parameters that maximize the likelihood of the model • Repeat until convergence
Clustering Data with EM (cont.) • Very popular for GMM fitting of noisy data • Guaranteed to converge (at some point)
Results: Qualitative Evaluation • Result: 5 pix drift, overall motion is 38 pix • Single frame motion varies from 0.1 pix to 13 pix
Discussion: Performance • Reliability of algorithm requires a larger number of generated samples and a GMM with a large number of components • Under these circumstances, the EM algorithm is bound to be slow • Correspondence of a single feature-point is insufficient for robust object tracking
Discussion: Future Work • Migration from MATLAB to OpenCV • Modification of GMM estimation to incorporate additional information and reduce the number of observations needed • Additional experiments • A tracker based on clustering of multiple feature-points using an affine motion model