Download
1 / 7
70 likes | 80 Views
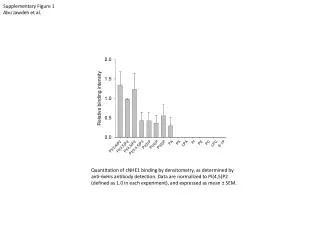
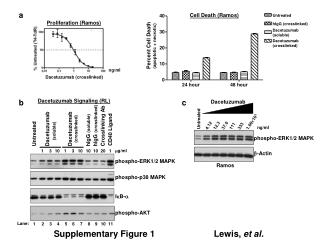
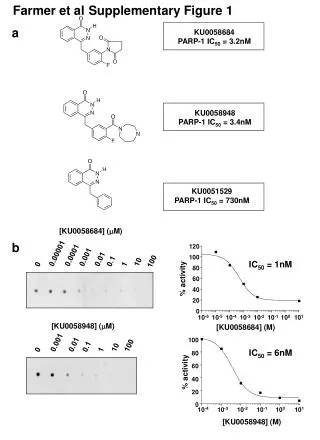
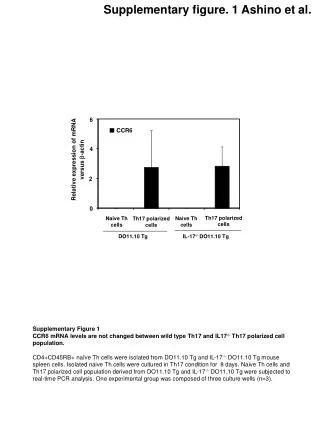
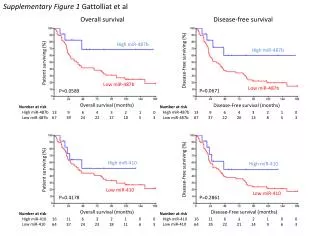
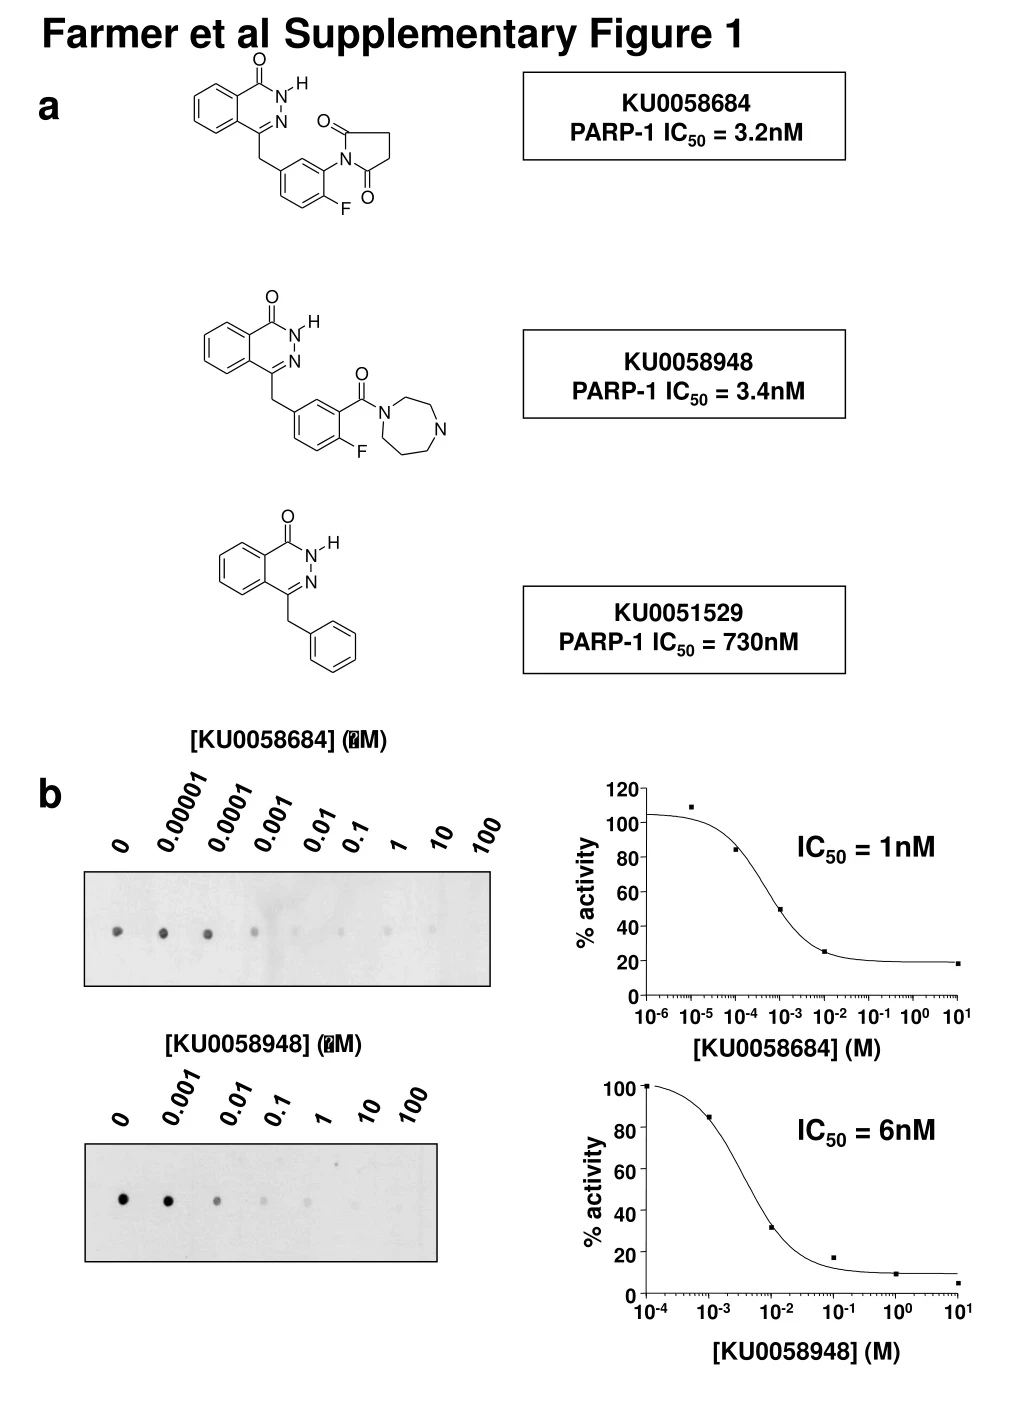
This figure presents the activity of KU0058684 and KU0058948 against PARP-1, as well as their effects on cell survival. It also shows the impact of different concentrations of KU0058684 on γH2AX and Rad51 foci formation, as well as chromosomal abnormalities in Brca1 and Brca2-deficient cells.

E N D
Farmer et alSupplementary Figure 1 [KU0058684] (M) 1 2 0 1 0 0 IC50 = 1nM 0.00001 0.0001 KU0051529 PARP-1 IC50 = 730nM 0.001 0.01 8 0 0.1 100 10 0 1 % activity 6 0 4 0 2 0 0 10-6 10-5 10-4 10-3 10-2 10-1 100 101 [KU0058684] (M) [KU0058948] (M) 1 0 0 IC50 = 6nM 8 0 0.001 0.01 100 0.1 10 0 1 6 0 % activity 4 0 2 0 0 10-4 10-3 10-2 10-1 100 101 [KU0058948] (M) a KU0058684 PARP-1 IC50 = 3.2nM KU0058948 PARP-1 IC50 = 3.4nM b
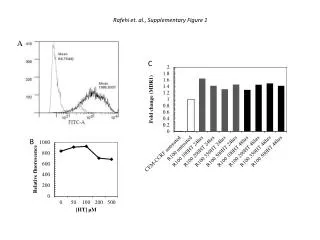
Farmer et alSupplementary Figure 2 1h 4h 24h log surviving fraction log surviving fraction log surviving fraction 11CO Cre6 Cre10 log surviving fraction 0 0 10-9 10-8 10-7 10-6 10-5 10-4 0 10-9 10-8 10-7 10-9 10-6 10-5 10-8 10-4 10-7 10-6 10-5 10-4 conc (M) conc (M) conc (M) 0 10-4 10-9 10-8 10-7 10-6 10-5 conc (M) D3 Cre15 Cre24 log surviving fraction log surviving fraction log surviving fraction 0 10-7 10-6 10-5 10-4 0 10-7 10-6 10-5 10-4 0 10-7 10-6 10-5 10-4 conc (M) conc (M) conc (M) a b 1h 4h 24h log surviving fraction log surviving fraction VC8 BAC VC8 0 10-9 10-8 10-7 10-6 10-5 10-4 10-9 10-8 10-7 10-6 10-5 10-4 0 conc (M) conc (M)
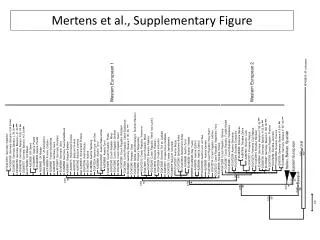
Farmer et alSupplementary Figure 3 MCF7-scrambled a KU0058684 KU0058948 KU0051529 log surviving fraction log surviving fraction log surviving fraction VC8 BAC VC8 10-9 10-6 10-5 10-9 10-7 10-5 10-4 10-7 10-6 10-4 10-8 10-8 10-11 10-9 10-7 10-6 10-5 10-4 10-8 0 10-11 10-10 10-11 10-10 10-10 0 0 conc (M) conc (M) conc (M) b KU0058948 KU0051529 0 0 MCF7-3.23 log surviving fraction log surviving fraction -1 -1 0 0 10-9 10-8 10-7 10-6 10-4 10-9 10-8 10-7 10-6 10-4 10-5 10-5 conc (M) conc (M)
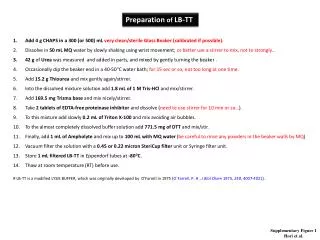
Brca2 wild-type Brca2 deficient Mean number of chromatid breaks Brca1 deficient Brca1 wild-type Mean number of complex chromatid rearrangements 3 3 2 2 0 10nM 1M 0 10nM 1M 0 10nM 0 10nM 1 1 0 0 Farmer et alSupplementary Figure 4 a Number per cell KU0058684 concentration
100 11CO Cre10 75 50 25 0 0 10-9 10-8 10-7 10-6 10-5 D3 Cre24 100 75 50 25 0 Farmer et alSupplementary Figure 4 b % of cells with >5 H2AX foci KU0058684 concentration (M) % of cells with >5 H2AX foci 0 10-9 10-8 10-7 10-6 10-5 KU0058684 concentration (M)
Farmer et alSupplementary Figure 4 c d 60 50 % of cells with >5 H2AX foci 40 pSUPER-eCFP-control Wild-type Brca1 deficient Brca2 deficient 30 100 90 20 80 10 70 % of cells with >5 H2AX foci 60 0 50 40 pSUPER-eCFP-Parp-1 pSUPER-eCFP-control pSUPER-eCFP-Parp-1 30 20 10 0 0 10 0 10 0 10 M KU0058684
Wild-type Brca1 deficient Brca2 deficient Wild-type 100 80 60 40 20 0 0 1 2 5 10 0 10 0 10 10 MKU0058684 MKU0051529 Farmer et alSupplementary Figure 4 e % of cells with > 5 Rad51 foci