Download
1 / 42
420 likes | 440 Views
This presentation covers logistic regression and survival analysis, explaining how to interpret results, measure time and events, and understand models such as the Cox Proportional Hazards Model. Logistic regression explores non-linear relationships between variables, while survival analysis focuses on event rates and time-to-event outcomes.

E N D
Logistic Regression & Survival Analysis Analysis of binary outcome & time to event data Larry Holmes, Jr Joabyer Hossain Stats Research, Lecture 7 November 13, 2008
Presentation Objectives • At the end of this presentation, participants should be able to : • Rationale for logistic regression, conduct and interpretation of result • Survival analysis • Measure Time and Events • Understand Truncation and Censoring • Understand Survival and Hazard Functions • Define Competing Risks • Understand Models and Hypothesis Testing • Log rank • Kaplan- Meier survival curve & estimates • Cox Proportional Hazards Model (semi-parametric model)
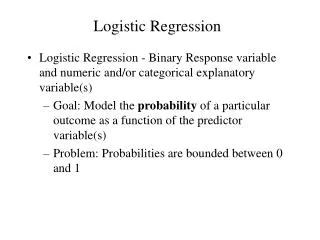
What is Logistic Regression? • Logistic regression is often used because the relationship between the DV (a discrete variable) and a predictor is non-linear • Blood glucose level and diabetes mellitus • Hypertension and LDL level
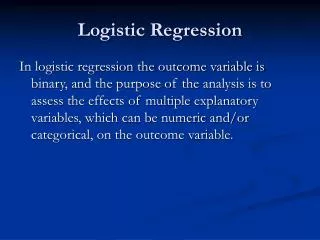
Logistic Regression In logistic regression: • Outcome variable is binary • Purpose of the analysis is to assess the effects of multiple explanatory variables, which can be numeric and/or categorical, on the outcome variable.
Requirements for Logistic Regression The Following need to be specified: • An outcome variable with two possible categorical outcomes (1=success; 0=failure). • Estimating the probability P of the outcome variable. • Linking the outcome variable to the explanatory variables. • Estimating the coefficients of the regression equation, as well as their confidence intervals. • Testing the goodness of fit of the regression model.
Measuring the Probability of Outcome The probability of the outcome is measured by the odds of occurrence of an event. If P is the probability of an event, then (1-P) is the probability of it not occurring. Odds of success = P / 1-P
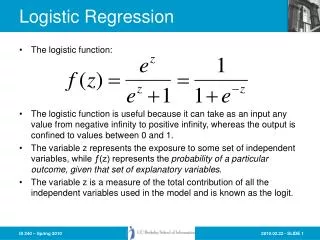
The logistic function • Where Y-hat is the estimated probability that the ith case is in a category and u is the regular linear regression equation:
Logistic function For a response variable y with p(y=1)= P and p(y=0) = 1- P Logistic regression will allow for the estimation of an equation that fits a curve the age/probability of CHD relationship Probability ofdisease A regression method to deal with the case when the dependent variable y is binary (dichotomous) x
The logistic function • Change in probability is not constant (linear) with constant changes in X • This means that the probability of a success (Y = 1) given the predictor variable (X) is a non-linear function, specifically a logistic function
The logistic function • It is not obvious how the regression coefficients for X are related to changes in the dependent variable (Y) when the model is written this way • Change in Y(in probability units)|X depends on value of X. Look at S-shaped function
The Logistic Regression The joint effects of all explanatory variables put together on the odds is Odds = P/1-P = e α+ β1X1 + β2X2 + …+βpXp Taking the logarithms of both sides Log{P/1-P} = log α+β1X1+β2X2+…+βpXp Logit P = α+β1X1+β2X2+..+βpXp The coefficients β1, β2, βp are such that the sums of the squared distance between the observed and predicted values (i.e. regression line) are smallest.
The Logistic Regression Logit p = α+ β1X1 +β2X2 + .. + βpXp α represents the overall disease risk β1 represents the fraction by which the disease risk is altered by a unit change in X1 β2 is the fraction by which the disease risk is altered by a unit change in X2 ……. and so on. What changes is the log odds. The odds themselves are changed by eβ If β= 1.6 the odds are e1.6 = 4.95
Logistic Regression-Demo • MS-Excel: No default functions • SPSS: Analyze > Regression > Binary Logistic > Select Dependent variable: > Select independent variable (covariate)
What is survival analysis? • Model time to failure or time to event • Unlike linear regression, survival analysis has a dichotomous (binary) outcome • Unlike logistic regression, survival analysis analyzes the time to an event • Why is that important? • Able to account for censoring • Can compare survival between 2+ groups • Assess relationship between covariates and survival time
Survival Analysis • Survival analysis deals with making inference about EVENT RATES • Rate at t = Rate among those at risk at t • Deals with Median survival (50%) . • Not Mean survival (need everyone to have an event) …..Why? • Survival vs. time-to-event • Outcome variable = event time • Examples of events: • Death, infection, MI,prostate cancer death, hospitalization • Recurrence of cancer after treatment
Types of censoring • Subject does not experience event of interest • Incomplete follow-up • Lost to follow-up • Withdraws from study • Dies (if not being studied) • Left or right censored
Survival Function • S(t) = P[ T ≥ t ] = 1 – P[ T < t ] • Plot: Y axis = % alive, X axis = time • Proportion of population still without the event by time t
Survival Curve Survival Curve
Hazard Function • Also termed incidence rate, instantaneous risk, force of mortality • λ(t) • Event rate at t among those at risk for an event • Key function • Estimated in a straightforward way • Censored • Truncated
Hazard Function • Event = death, scale = months since Tx • “λ(t) = 1% at t = 12 months” • “At 1 year, patients are dying at a rate of 1% per month” • “At 1 year the chance of dying in the following month is 1%”
Relationship between survivor function and hazard function • Survivor function, S(t) defines the probability of surviving longer than time t • this is what the Kaplan-Meier curves show. • Hazard function is the derivative of the survivor function over time h(t)=dS(t)/dt • instantaneous risk of event at time t (conditional failure rate) • Survivor and hazard functions can be converted into each other
Use of survival analysis: clinical trial • Accrual into the study over 2 years • Data analysis at year 3 • Reasons for exiting a study • Died • Alive at study end • Withdrawal for non-study related reasons (LTFU) • Died from other causes
Kaplan-Meier • One way to estimate survival • Nice, simple, can compute by hand • Can add stratification factors • Cannot evaluate covariates like Cox model • No sensible interpretation for competing risks
Kaplan-Meier estimate • Multiply together a series of conditional probabilities
Limit of Kaplan-Meier curves • What happens when you have several covariates that you believe contribute to survival? • Example • Smoking, hyperlipidemia, diabetes, hypertension, contribute to time to myocardial infarct • Can use stratified K-M curves – for 2 or maybe 3 covariates • Need another approach – multivariate Cox proportional hazards model is most common -- for many covariates • (think multivariate regression or logistic regression rather than a Student’s t-test or the odds ratio from a 2 x 2 table)
Multivariable method: Cox proportional hazards • Needed to assess effect of multiple covariates on survival • Cox-proportional hazards is the most commonly used multivariable survival method
Cox proportional hazard model • Works with hazard model • Conveniently separates baseline hazard function from covariates • Baseline hazard function over time • h(t) = ho(t)exp(B1X+Bo) • Covariates are time independent • B1 is used to calculate the hazard ratio, which is similar to the relative risk • Semi-parametric
Cox Proportional Hazards Model • Add covariates to the model • Change in a prognostic factor → proportional change in the hazard (on the log scale) • Can test the effect of the prognostic factor as in linear regression - H0:β=0
Limitations of Cox PH model • Does not accommodate variables that change over time • Most variables (e.g. gender, ethnicity, or congenital condition) are constant • If necessary, one can program time-dependent variables • When might you want this? • Baseline hazard function, ho(t), is never specified • You can estimate ho(t) accurately if you need to estimate S(t).
Summary • Survival analyses quantifies time to a single, dichotomous event • Handles censored data well • Survival and hazard can be mathematically converted to each other • Kaplan-Meier survival curves can be compared statistically and graphically • Cox proportional hazards models help distinguish individual contributions of covariates on survival, provided certain assumptions are met.