Download
1 / 45
450 likes | 593 Views
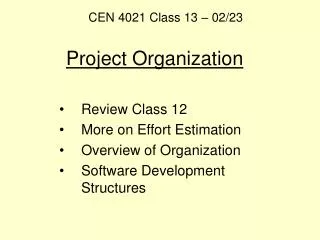
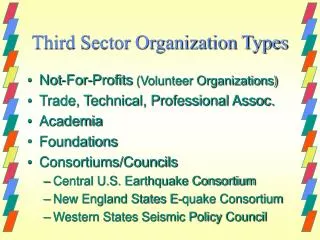
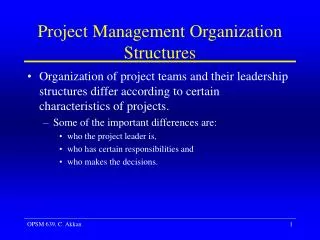
Project Organization Types. • Functional : Project is divided and assigned to appropriate functional entities with the coordination of the project being carried out by functional and high-level managers

E N D
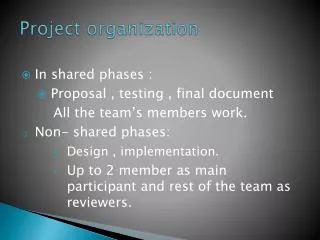
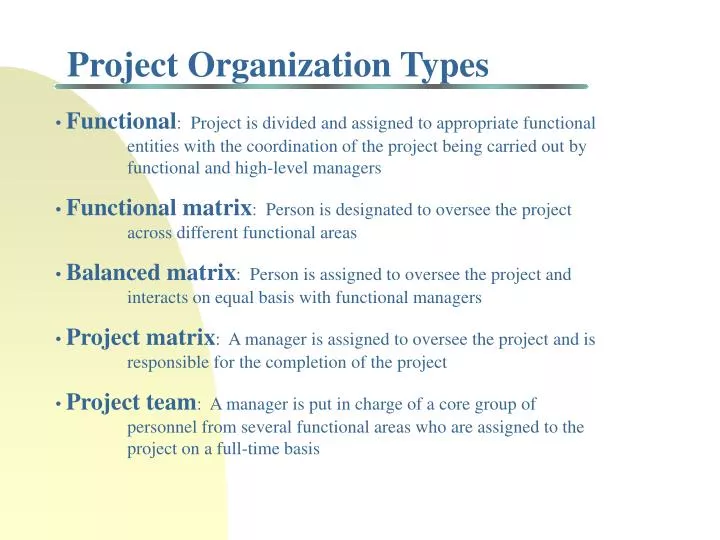
Project Organization Types • Functional: Project is divided and assigned to appropriate functional entities with the coordination of the project being carried out by functional and high-level managers • Functional matrix: Person is designated to oversee the project across different functional areas • Balanced matrix: Person is assigned to oversee the project and interacts on equal basis with functional managers • Project matrix: A manager is assigned to oversee the project and is responsible for the completion of the project • Project team: A manager is put in charge of a core group of personnel from several functional areas who are assigned to the project on a full-time basis
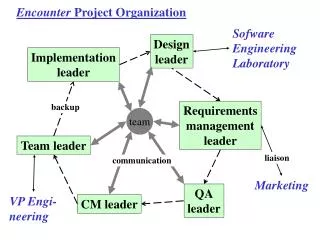
Functional Matrix Project Matrix Project Team Organization Functional Organization Balanced Matrix C o n t i n u u m Project fully managed by functional managers Project fully managed by project team manager Project Organization Continuum
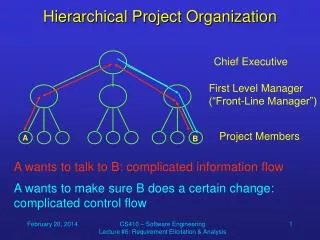
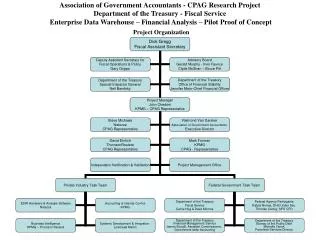
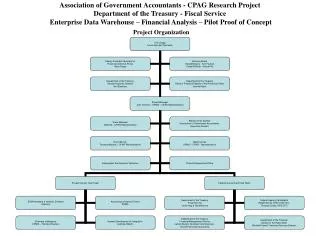
Dean Associate Dean for Undergraduate Program Associate Dean for MBA Programs Director of Doctoral Program Accounting Department Chair Larry Zelda Diane Marketing Department Chair Curly Bob Barby Finance Department Chair Moe Gloria Leslie A Business School as a Matrix Organization
Matrix Organizations & Project Success • Matrix organizations emerged in 1960’s as an alternative to traditional means of project teams • Became popular in 1970’s and early 1980’s • Still in use but have evolved into many different forms • Basic question: Does organizational structure impact probability of project success?
Organizational Structure & Project Success • Studies by Larson and Gobeli (1988, 1989) • Sent questionnaires to 855 randomly selected PMI members • Asked about organizational structure (which one best describes the primary structure used to complete the project) • Perceptual measures of project success: successful, marginal, unsuccessful with respect to : 1) Meeting schedule 2) Controlling cost 3) Technical performance 4) Overall performance • Respondents were asked to indicate the extent to which they agreed with each of the following statements: 1) Project objectives were clearly defined 2) Project was complex 3) Project required no new technologies 4) Project had high priority within organization
Study Data • Classification of 547 respondents (64% response rate) 30% project managers or directors of project mgt programs 16% top management (president, vice president, etc.) 26% managers in functional areas (e.g., marketing) 18% specialists working on projects • Industries included in studies 14% pharmaceutical products 10% aerospace 10% computer and data processing products others: telecommunications, medical instruments, glass products, software development, petrochemical products, houseware goods • Organizational structures: 13% (71): Functional organizations 26% (142): Functional matrix 16.5% (90): Balanced matrix 28.5% (156): Project matrix 16% (87): Project team
ANOVA Results by Organizational Structure *Statistically significant at a p<0.01 level
Summary of Results • Project structure significantly related to project success • New development projects that used traditional functional organization had lowest level of success in controlling cost, meeting schedule, achieving technical performance, and overall results • Projects using either a functional organization or a functional matrix had a significantly lower success rate than the other three structures • Projects using either a project matrix or a project team were more successful in meeting their schedules than the balanced matrix • Project matrix was better able to control costs than project team • Overall, the most successful projects used a balanced matrix, project team, or--especially--project matrix
When you subcontract part (or all) of a project, you are forming a business alliance.... Subcontracting = Business Alliance Intelligent Business Alliances: “A business relationship for mutual benefit between two or more parties with compatible or complementary business interests and/or goals” Larraine Segil, Lared Presentations
Communication and Subcontractors What types of communication mechanism(s) will be used between company and subcontractor(s)? WHAT a company communicates..... HOW a company communicates..... How is knowledge transferred?
Personality Compatibility Subcontractor Personality Corporate Personality Project Individual Personality
Subcontracting Issues • • What part of project will be subcontracted? • • What type of bidding process will be used? What type of contract? • • Should you use a separate RFB (Request for Bids) for each task or use one RFB for all tasks? • • What is the impact on expected duration of project? • • Use a pre-qualification list? • • Incentives? Bonus for finishing early? Penalties for finishing after stated due date? • • What is impact of risk on expected project cost?
Fixed Price Contract Client pays a fixed price to the contractor irrespective of actual audited cost of project Cost Plus Contract Client reimburses contractor for all audited costs of project (labor, plant, & materials) plus additional fee (that may be fixed sum or percent of costs incurred) Units Contract Client commits to a fixed price for a pre-specified unit of work; final payment is based on number of units produced Basic Contract Types
Incentive (Risk Sharing) Contracts General Form: Payment to Subcontractor = Fixed Fee + (1 - B) (Project Cost) where B = cost sharing rate Cost Plus Contract Fixed Price Contract B = 0 Linear & Signalling Contracts B = 1
Why Use Incentive Contracts? Expected Cost of Project = $100M Two firms bid on subcontract Firm 1 Firm 2 Fixed Fee (bid) $5 M $7 M Project Cost $105 M $95 M (inefficient producer) What is result if Cost Plus Contract (B = 0) used?
WAC 236-48-093: A contract shall be awarded to the lowest responsible and responsive bidder based upon, but not limited to, the following criteria where applicable and only that which can be reasonably determined: 1) The price and effect of term discounts...price may be determined by life cycle costing if so indicated in the invitation to bid 2) The conformity of the goods and/or services bid with invitation for bid or request for quotation specifications depicting the quality and the purposes for which they are required. 3) The ability, capacity, and skill of the bidder to perform the contract or provide the services required. 4) The character, integrity, reputation, judgement, experience, and efficiency of the bidder. 5) Whether the bidder can perform the contract with the time specified. 6) The quality of performance on previous contracts for purchased goods or services. 7) The previous and existing compliance by the bidder with the laws relating to the contract for goods and services. 8) Servicing resources, capability, and capacity. Washington State Bid Code (WAC 236-48-093)
“In the low-bid system, the owner wants the most building for the least money, while the contractor wants the least building for the most money. The two sides are in basic conflict.” Steven Goldblatt Department of Building Construction University of Washington The Seattle Times, Nov 1, 1987 Competitive Bidding: Low-Bid System
Precedence Networks Networks represent immediate precedence relationships among tasks (also known as work packages or activities) and milestones identified by the WBS Milestones (tasks that take no time and cost $0 but indicate significant events in the life of the project) Two types of networks: Activity-on-Node (AON) Activity-on-Arc (AOA) All networks: must have only one (1) starting and one (1) ending point
A C B D Start End Precedence Networks: Activity-on-Node (AON)
Precedence Diagramming Standard precedence network (either AOA or AON) assumes that a successor task cannot start until the predecessor(s) task(s) have been completed. Alternative relationships can be specified in many software packages: Finish-to-start (FS = a):Job B cannot start until a days after Job A is finished Start-to-start (SS = a):Job B cannot start until a days after Job A has started Finish-to-finish (FF = a):Job B cannot finish until a days after Job A is finished Start-to-finish (SF = a):Job B cannot finish until a days after Job A has started
Start Task C 11 months Task A 7 months Task B 3 months End Critical Path Method (CPM): Basic Concepts
Task A 7 months Task B 3 months Task C 11 months Start End ESA = 0 LFA = 8 ESB = 7 LFB = 11 ESStart = 0 LFStart = 0 ESEnd = 11 LFEnd = 11 ESC = 0 LFC = 11 Critical Path Method (CPM): Basic Concepts ESj = Earliest starting time for task (milestone) j LFj = Latest finish time for task (milestone) j
ES = A LF = A ES = F LF = F ES = D LF = D ES = END LF = END ES = B LF = B ES = E LF = E ES = C LF = C Ta Ta Ta sk sk sk A B D Ta sk F Ta Ta sk sk E C 12 9 14 w w w k k k s s s 6 20 w w k k s s 9 w k s START END Critical Path Method (CPM): Example 2
Example 2: Calculating Total Slack (TSi) Total Slack for task i = TSi = LFi - ESi - ti
Slack (Float) Definitions (for task i) Total Slack (TSi) = LFi - ESi - ti Free Slack (FSi) = ESi,min - ESi - ti where ESi,min = minimum early start time of all tasks that immediately follow task i = min (ESj for all task j Si) Safety Slack (SSi) = LFi - LFi,max - ti where LFi,max = maximum late finish time of all tasks that immediately precede task i = min (LFj for all task j Pi) Independent Slack (ISi) = max (0, ESi,min- LFi,max - ti)
Example #2: LP Model Decision variables: STARTj = start time for task j END = ending time of project (END milestone) Minimize END subject to STARTj ≥ FINISHi for all tasks i that immediately precede task j STARTj ≥ 0for all tasks j in project where FINISHi = STARTi + ti = STARTi + duration of task i
Gantt Chart Microsoft Project 4.0
Project Budgeting • The budget is the link between the functional units and the project • Should be presented in terms of measurable outputs • Budgeted tasks should relate to work packages in WBS and organizational units responsible for their execution • Should clearly indicate project milestones • Establishes goals, schedules, and assigns resources (workers, organizational units, etc.) • Should be viewed as a communication device • Serves as a baseline for progress monitoring & control • Update on rolling horizon basis • May be prepared for different levels of aggregation (strategic, tactical, short-range)
Project Budgeting (cont’d) • Top-down Budgeting: Aggregate measures (cost, time) given by top management based on strategic goals and constraints • Bottom-up Budgeting: Specific measures aggregated up from WBS tasks/costs and subcontractors
Issues in Project Budgets • How to include risk and uncertainty factors? • How to measure the quality of a project budget? • How often to update budget? • Other issues?
ES = 0 A LF = 14 A ES = 26 F LF = 35 F ES = 14 D LF = 26 D ES = 35 END LF = 35 END ES = 0 B LF = 14 B ES = 26 E LF = 35 E ES = 0 C LF = 29 C Ta Ta Ta sk sk sk A B D Ta sk F Ta Ta sk sk E C 12 9 14 w w w k k k s s s 6 20 w w k k s s 9 w k s START END Critical Path Method (CPM): Example 2
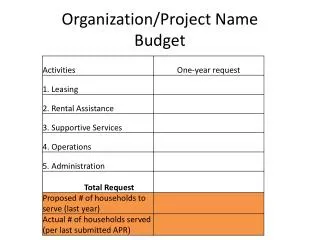
Project Budget Example Cost for Resource A worker = $400/week Cost for Resource B worker = $600/week
Project Budget Example (cont’d) W e e k W e e k
Cumulative Costs Range of feasible budgets
Managing Cash Flows • Want to manage payments and receipts • Must deal with budget constraints on project and organization requirements (e.g., payback period) • Organization profitability
M1 END M2 Task B 8 mos Task C 4 mos Task A 2 mos Task D 8 mos Task E 3 mos START Receive payment of $3000 Receive payment of $3000 Make payment of $5000 Cash Flow Example
Material Management Issues When to order materials? How much to order? Example: • Single material needed for Task B (2 units) and Task E (30 units) • Fixed cost to place order = S • Cost of holding raw materials proportional to number of unit-weeks in stock • Cost of holding finished product greater than the cost of holding raw materials • Project can be delayed (beyond 17 weeks) at cost of $P per week
Task B 8 wks Task C 5 wks Task A 4 wks 2 units End Task D 6 wks Task E 2 wks Task F 3 wks 30 units Start Material Management Example
Lot-Sizing Decisions in Projects • To minimize holding costs, only place orders at Late Starting Times • Can never reduce holding costs by delaying project Time 1 2 3 4 5 6 7 8 9 10 11 12 Demand: 2 30 Order option #1: 32 Order option #2: 2 30 Choose the option that minimizes inventory cost = order cost + holding cost of raw materials