Download
1 / 11
110 likes | 192 Views
Warm-Up #1 1/25/2013. The following data set represents the height of a ball over a period of distance, in feet. Determine whether a linear or quadratic equation would be the best fit. Find this equation and explain why.

E N D
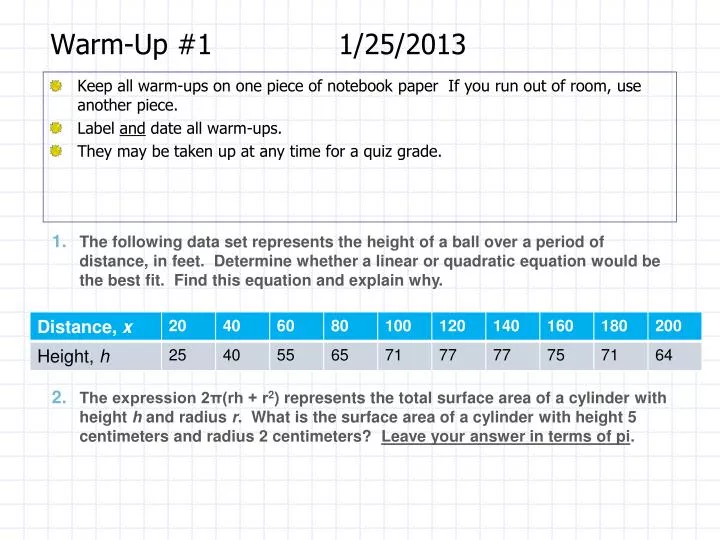
Warm-Up #1 1/25/2013 The following data set represents the height of a ball over a period of distance, in feet. Determine whether a linear or quadratic equation would be the best fit. Find this equation and explain why. The expression 2π(rh + r2) represents the total surface area of a cylinder with height h and radius r. What is the surface area of a cylinder with height 5 centimeters and radius 2 centimeters? Leave your answer in terms of pi. Keep all warm-ups on one piece of notebook paper If you run out of room, use another piece. Label and date all warm-ups. They may be taken up at any time for a quiz grade.
Functions and relations Chapter 5
Domain: the set of all inputs (x-values) in a relation. Range: the set of all outputs (y-values) in a relation.
How would you use your calculator to solve 52? Input Output • The number you entered is the input number (or x-value on a graph). • The result is the output number (or y-value on a graph). 5 x2 25
A function is a relation in which each of its inputs (x-values) provides exactly one output (y-value). A relation is a set of data with no restriction on input-to-output values. • Graph • Equation • Table of values • A set of ordered pairs • Mapping There are many ways to represent relations: These are all ways of showing a relationship between two variables.
Function X values are always located on the right and y values are on the left. They can be represented by words, symbols or numbers. This represents a function as every input value (x) has only been used once.
A Relation is a set of data with no restriction on input-to-output values (x and y values may be repeated). This represents only a relation because the input value or x-value of 2 was used twice. Therefore this relation is not a Function. All functions are relations but not all relations are functions!
a) b)
20 Hours 25 Hours 30 Hours 40 Hours $200 $425 $350 $450
Vertical Line Test: if every vertical line you can draw goes through only 1 point then the relation is a function.