Download
1 / 64
640 likes | 792 Views
Vulnerability of US Non-Irrigated Commodity Crops to Extremes of Weather and Climate. Eugene S. Takle Professor Department of Agronomy Department of Geological and Atmospheric Science Director, Climate Science Program Iowa State University Ames, IA 50011.

E N D
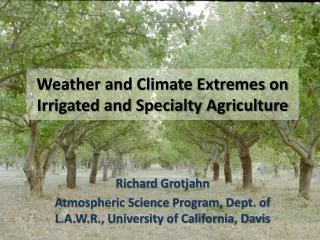
Vulnerability of US Non-Irrigated Commodity Crops to Extremes of Weather and Climate Eugene S. Takle Professor Department of Agronomy Department of Geological and Atmospheric Science Director, Climate Science Program Iowa State University Ames, IA 50011 US CLIVAR/NCAR ASP Researcher Colloquium Statistical Assessment of Extreme Weather Phenomena under Climate Change NCAR Foothills Lab, Boulder, Colorado, USA June 13-17, 2011
Provocative thoughts • If it weren’t for farmers we would all be hunter-gatherers
Provocative thoughts • If it weren’t for farmers we would all be hunter-gatherers • Farmers allow the rest of us time to sit around and think about statistics and climate change
Provocative thoughts • If it weren’t for farmers we would all be hunter-gatherers • Farmers allow the rest of us time to sit around and think about statistics and climate change • Maybe we should help farmers do their job better (or at least as well as in the past)
Provocative thoughts cont’d • No civilization that depended on irrigation for its food supply has survived.
Provocative thoughts cont’d • No civilization that depended on irrigation for its food supply has survived. • It is our self-interest to assess the impact of climate extremes on rainfed agriculture
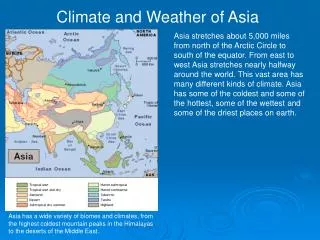
Overview • Rainfed agriculture; commodity crops of the Midwest • Production and impacts of technology and weather/climate on trends • Climate extremes • Climate conditions leading to changes from “expected yields” • Recent climate changes and farmer adaptations • Farmer weather-related decision calendar
Wheat Corn and Soybean US Precipitation climatology
Commodity Crops • Corn (maize) • Soybean • Wheat • Rice
Yield, Bushels per Acre KR Lamkey
US Corn Yields (Bushels/Acre) 1 bu = 25.5 kg 1 acre = 0.405 ha 1 bu/ac= 63 kg/ha 1.96 bu/ac/y KR Lamkey
US Annual Corn yields Chad Hart
FactorPercent Cold Winter 0.9 Decline in Price 6.6 Drought 35.5 Excess Moist/Precip/Rain 38.4 Flood 2.6 Freeze 0.1 Hail 7.2 Heat 1.2 Hot Wind 0.0 Mycotoxin (Aflatoxin) 1.0 Plant Disease 0.3 Winds/Excess Win 5.0 Other 1.1 Total 100.0 Insured Crop Loss for Corn in Iowa* *Milliman, Inc., based on 1995-2006 data from the Risk Management Agency Website (http://www.rma.usda.gov/)
US Annual Wheat yields Bushels per acre Chad Hart
US Wheat Yield Deviation from Expected Chad Hart
US Annual Soybean yields Bushels per acre Chad Hart
US Soybean Yield Deviation from Expected Chad Hart
Insured Crop Loss for Soybeans in Iowa* Factor Percent Cold Winter 0.6 Decline in Price 4.8 Drought 56.8 Excess Moist/Precip/Rain 20.2 Flood 1.4 Freeze 0.1 Hail 13.0 Heat 0.9 Hot Wind 0.0 Mycotoxin (Aflatoxin) 0.0 Plant Disease 1.1 Winds/Excess Wind 0.2 Other 1.1 Total 100.0 *Milliman, Inc., based on 1995-2006 data from the Risk Management Agency Website (http://www.rma.usda.gov/)
Much of the trend and part of reduced interannual variability is due to technology • But not all…
Yield, Bushels per Acre KR Lamkey
Ave planting date one week earlier Kucharik. 2006. Agron. J. 98:1544 C Kucharik
Des Moines Airport Data 1983: 13 1988: 10 1977: 8 2009: 0 2010: 0
Des Moines Airport Data 1983: 13 1988: 10 6 days ≥ 100oF in the last 22 years 1977: 8 2009: 0 2010: 0
Observed Summer (JJA) Daily Maximum Temperature Changes (K), 1976-2000 Adapted from Folland et al. [2001]
“Warming Hole”: Regional climate model simulations of changes in daily maximum summertime temperatures between 1990s and 2040s DTmax (JJA) ˚C • Pan, Z., R. W. Arritt, E. S. Takle, W. J. Gutowski, Jr., C. J. Anderson, and M. Segal,2004: Altered hydrologic feedback in a warming climate introduces a “warming hole”. Geophys. Res. Lett.31, L17109, doi:10.1029/2004GL020528.
Something is masking summer expression of the underlying warming
NASA GISS transient model from 1980’s projected little or no warming in summer (Takle and Zhong, 1991)
Iowa State-Wide Average Data Totals above 40” 8 years 2 years 10% increase 34.0” 30.8”
Cedar Rapids Data Years with more than 40 inches 11 1 32% increase 28.0” 37.0”
Cedar Rapids Data 1.25 inches Years having more than 8 days 13 2 6.6 days 4.2 days 57% increase