Download
1 / 13
140 likes | 158 Views
Learn about Cartesian coordinate system, linear equations, plotting points, solutions, and graphing techniques. Understand the algebra of functions and linear inequalities. Explore how to graph linear equations and nonlinear equations efficiently.

E N D
Chapter 3 Graphs and Functions
Chapter Sections 3.1 – Graphs 3.2 – Functions 3.3 – Linear Functions: Graphs and Applications 3.4 – The Slope-Intercept Form of a Linear Equation 3.5 – The Point-Slope Form of a Linear Equation 3.6 – The Algebra of Functions 3.7 – Graphing Linear Inequalities
Graphs § 3.1
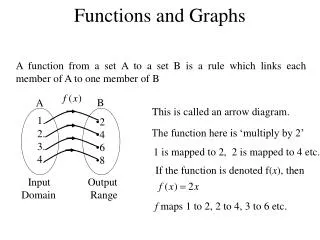
Definitions A graphshows the relationship between two variables in an equation. The Cartesian (rectangular) coordinate systemis a grid system used to draw graphs. It is named after its developer, René Descartes (1596-1650).
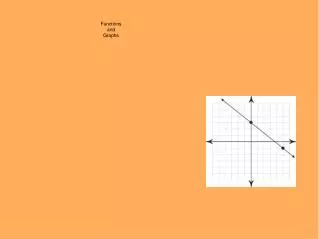
y x Definitions II I III IV The two intersecting axis form four quadrants,numbered I through IV. The horizontal axis is called the x-axis. The vertical axis is called the y-axis.
y x Definitions Origin (0, 0) The point of intersection of the two axes is called the origin. The coordinates, or the value of the x and the value of the y determines the point. This is also called an orderedpair.
Plotting Points Starting at the origin, move 3 places to the right. Plot the point (3, -4). The x-coordinate is 3 and the y-coordinate is –4.
Plotting Points Then move 4 places down. Plot the point (3, -4). The x-coordinate is 3 and the y-coordinate is –4.
Plotting Points (3, -4) Plot the point (3, -4). The x-coordinate is 3 and the y-coordinate is –4.
Linear Equations A linear equation in two variablesis an equation that can be put in the form ax + by = c where a, b, and c are real numbers. This is called the standard formof an equation. Examples: 4x – 3y = 12 x + 2y = -35
Solutions to Equations The solutionto an equation is the ordered pair that can be substituted into the equation without changing the “validity” of the equation. Is (3, 0) a solution to the equation 4x – 3y = 12? 4x – 3y = 12 4(3) – 3(0) = 12 12 – 0 = 12 12 = 12 Yes, it is a solution.
Graphing A graphof an equation is an illustration of the set of points whose ordered pairs are solutions to the equation. A set of points that are in a straight line are collinear. The points (-1, 4), (1, 1) and (4, -3) are collinear.
Graph Nonlinear Equations Equations whose graphs are not straight lines are called nonlinear equations. Example: Graph y = x2 – 4. Use the following values for x: -3, -2, -1, 0, 1, 2, and 3.