Download
1 / 65
660 likes | 820 Views
An integrated statistical framework for mapping quantitative traits in mice. Richard Mott Jonathan Flint Wellcome Trust Centre for Human Genetics, Oxford Richard.Mott@well.ox.ac.uk. Outline. Introduction QTL Mapping Multiple Phenotype Heterogeneous Stock Experiment

E N D
An integrated statistical framework for mapping quantitative traits inmice Richard Mott Jonathan Flint Wellcome Trust Centre for Human Genetics, Oxford Richard.Mott@well.ox.ac.uk
Outline • Introduction • QTL Mapping • Multiple Phenotype Heterogeneous Stock Experiment • Testing for Functional Variants • Expression Data • Future
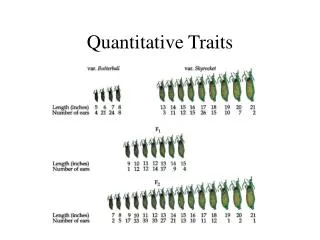
Genetic Traits • Quantitative (height, weight) • Dichotomous (affected/unaffected) • Factorial (blood group) • Mendelian - controlled by single gene (cystic fibrosis) • Complex – controlled by multiple genes*environment (diabetes, asthma)
Quantitative Trait Loci QTL: Quantitative Trait Locus chromosome genes
Quantitative Trait Loci QTL: Quantitative Trait Locus chromosome QTG: Quantitative Trait Gene
Quantitative Trait Loci QTL: Quantitative Trait Locus chromosome QTG: Quantitative Trait Gene QTN: Quantitative Trait Nucleotide
Disease studied directly Population and environment stratification Very many SNPs (1,000,000?) required Hard to detect trait loci – very large sample sizes required to detect loci of small effect (5,000-10,000) Potentially very high mapping resolution – single gene Very Expensive Animal Model required Population and environment controlled Fewer SNPs required (~100-10,000) Easy to detect QTL with ~500 animals Poorer mapping resolution – 1Mb (10 genes) Relatively inexpensive Map inHumans or Animal Models ?
Inbred founders Mosaic Crosses G3 GN F20 inbreeding mixing chopping up Heterogeneous Stock, Advanced Intercross, Random Outbreds F2, diallele Recombinant Inbred Lines
Sizes of Behavioural QTL in rodents (% of total phenotypic variance)
Mapping Resolution • F2 crosses • Powerful at detecting QTL • Poor at Localisation – 20cM • Too few recombinants • Increase number of recombinants: • more animals • more generations in cross
Heterogeneous Stocks • cross 8 inbred strains for >10 generations
Heterogeneous Stocks • cross 8 inbred strains for >10 generations
Heterogeneous Stocks • cross 8 inbred strains for >10 generations 0.25 cM
Multiple Phenotypes measured on a Heterogeneous Stock • 2000 HS mice (Northport, Bob Hitzeman) 84 families 40th generation • 150 traits measured on each animal • Standardised phenotyping protocol • Covariates Recorded • Experimenter • Time/Date • Litter • Microchipping
Phenotypes • Anxiety (Conditioned and Unconditioned Tests) • Asthma (Plethysmography) • Diabetes (Glucose Tolerance Test) • Haematology • Immunology • Biochemistry • Wound Healing (Ear Punch) • Gene Expression • ….others….
Genotyping • 15360 SNPs genotyped by Illumina • 2000 HS mice • 300 HS parents • 8 inbred HS founders • 500 other inbreds • www.well.ox.ac.uk/mouse/snp.selector • 13459 SNPs successful • 99.8% accuracy (parent-offspring)
Distribution of Marker Spacing (chromosome X) (9 Markers)
LD Decay with distance 99.2% marker pairs on different autosomes have R2 < 0.05.
Genetic Drift in HS • 40 generations of breeding • Allele Frequency in founders will drift • 8% of genome fixed
Analysis • Automated analysis pipeline • R HAPPY package • Single Marker Association • Each phenotype analysed independently • Transformed to Normality, outliers removed • Tailored set of covariates • Linear models for most phenotypes • Survival models for latency phenotypes
Twisted Pair Analysis of Heterogeneous Stock chromosome markers • Want to predict ancestral strain from genotype • We know the alleles in the founder strains • Single marker association lacks power, can’t distinguish all strains • Multipoint analysis – combine data from neighbouring markers alleles 1 1 2 1 2 1 1 1 2 2 1 2 2 1 1 1 1 2 1 1 2 1 1 1 1 1 2 2 1 2 1 2 1 1
Twisted Pair Analysis of Heterogeneous Stock chromosome markers • Hidden Markov model HAPPY • Hidden states = ancestral strains • Observed states = genotypes • Unknown phase of genotypes • Analyse both chromosomes simultaneously • Twisted pair of HMMs • Mott et al 2000 PNAS alleles 1 1 2 1 2 1 1 1 2 2 1 2 2 1 1 1 1 2 1 1 2 1 1 1 1 1 2 2 1 2 1 2 1 1
Testing for a QTL • piL(s,t) = Prob( animal i is descended from strains s,t at locus L) • piL(s,t) calculated by HMM using • genotype data • founder strains’ alleles • Phenotype is modelled E(yi) = Ss,tpiL(s,t)T(s,t) + mi Var(yi) = s2 • Test for no QTL at locus L • H0: T(s,t) are all same • ANOVA partial F test
Genome Scan • Additive and dominance models • Record all peaks that exceed 5% genome-wide significance, • Threshold based on 200 permutations • 9000 preliminary candidate QTL found
Jointly Significant QTL • Forward selection over candidate QTL • Test each QTL conditional on other QTL • Rescan genome conditional on selected QTLs to identify new QTL • 5% genome-wide significance threshold • Bootstrap residuals to find QTL confidence regions
Results • ~7 jointly significant QTL per phenotype • 95% Confidence Interval ~ 2 Mb • ~50% of QTL have a significant non-additive component • Only 3 phenotypes were explained by single major QTL • Most phenotypes are complex
Distribution of QTL Effects Mean Effect size 2.7%
Distribution of #Genes under QTL #QTL +20 QTL With > 10 genes #genes
%Variance Explained [% Additive Genetic Variance calculated using 3-generation pedigree data, not genotypes]
A known QTL: HDL HS mapping Wang et al, 2003
New QTLs: two examples • Ear Punch Hole Area Regrowth • wound healing • Cue Conditioning Freeze.During.Tone • measure of fear
Cue Conditioning • Freeze.During.Tone: huge effect, small number of genes chr15 cntn1: Contactin precursor (Neural cell surface protein)
Gene x Environment Gene x Sex • Repeat analysis looking for QTLs that interact with • Gender • Litter number • Season, Month, etc • Experimenter • Compare models E(y) = m + locus + env E(y) = m + locus * env
Gene x Environment • 431 jointly significant GxE QTLs • 27 gene x experimenter, • 81 gene x litter number, • 67 gene x age, • 105 gene x study day • 151 gene x season. • 13% of variation is GxE • 25 GxE QTLs overlapped with original joint QTL • defined as lying within 4Mb of the peak position • 42 GxSex QTLs
Testing for Functional Variants • Is a SNP functional for a trait? • Is a functional assay measured in founders related to a trait? • Gene expression • DNA-Protein binding