Download
1 / 42
430 likes | 613 Views
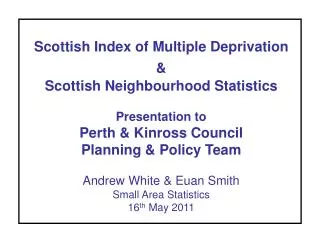
Scottish Index of Multiple Deprivation & Scottish Neighbourhood Statistics Presentation to Big Lottery Fund Andrew White, Euan Smith & Jeremy Chan Small Area Statistics 20 th January 2011. Running order. SIMD - What it is - Some results - The website SNS - What is available

E N D
Scottish Index of Multiple Deprivation&Scottish Neighbourhood StatisticsPresentation to Big Lottery FundAndrew White, Euan Smith & Jeremy Chan Small Area Statistics20th January 2011
Running order SIMD - What it is - Some results - The website SNS - What is available - Standard reports - Advance reports and creating an area of interest Interactive session
A quick run through of… • What is SIMD 2009? • Some things you should know… • Headline findings • How to find out more - SIMD website
What is the SIMD? • The Scottish Index of Multiple Deprivation identifies small area concentrations of multiple deprivation across all of Scotland. multiple deprivation
SIMD domains • SIMD 2009 domains • Income • Employment • Health • Education, skills & training • Geographic access to services • Crime • Housing 28% 28% 14% 14% 9% 5% 2%
What is the SIMD? • The Scottish Index of Multiple Deprivation identifies small area concentrations of multiple deprivation across all of Scotland. • Relative measure ranking the 6,505 datazones in Scotland from 1 being most deprived to 6,505 being the least deprived. Does this for each domain and overall. datazones
What aredatazones? • Statistical geography • Average population of 750 people • 6,505 datazones in Scotland • No names, but codes like S01000001
What is the SIMD? • The Scottish Index of Multiple Deprivation identifies small area concentrations of multiple deprivation across all of Scotland. • Relative measure ranking the 6,505 datazones in Scotland from 1 being most deprived to 6,505 being the least deprived. Does this for each domain and overall. • Analysis often focuses on the 15% most deprived. There are 976 datazones in the 15% most deprived (and 651 in the 10%). 15%
What is the SIMD? • The Scottish Index of Multiple Deprivation identifies small area concentrations of multiple deprivation across all of Scotland. • Relative measure ranking the 6,505 datazones in Scotland from 1 being most deprived to 6,505 being the least deprived. Does this for each domain and overall. • Analysis often focuses on the 15% most deprived. There are 976 datazones in the 15% most deprived (and 651 in the 10%). • SIMD is one measure of deprivation, it is not the only one.
SIMD 2009 • Update to SIMD 2006 (and SIMD 2004) • 38 indicators across 7 aspects of deprivation (domains) • Same domains as in SIMD 2006 • Some changes to indicators • Mostly 2007 / 2008 data
Things you should know… • The Index is relative i.e. it shows whether an area is more or less deprived than another one but not how much more or less deprived. • The least deprived area is not the most affluent, it just lacks deprivation. • Not everyone living in a deprived area is deprived. Nor do all deprived people live in the most deprived areas. • There will always be 976 datazones in the 15% most deprived – if a datazone moves out another will move in.
Headline findings • Improvements in Glasgow
Headline findings • Improvements in Glasgow • However, around 31% of the 15% most deprived datazones in Scotland are in Glasgow.
SIMD 2009 – National Share (part 1) *The national share is the number/percentage of datazones in the (e.g.)15% most deprived in Scotland that fall in each Local Authority
Headline findings • Improvements in Glasgow • However, around 31% of the 15% most deprived datazones in Scotland are in Glasgow. • Which means 43% of Glasgow’s datazones are in the 15% most deprived
SIMD 2009 – Local Share (part 1) *The local share is the percentage of datazones within a Local Authority that fall within the (e.g.) 15% most deprived in Scotland
Headline findings • Improvements in Glasgow • However, around 31% of the 15% most deprived datazones in Scotland are in Glasgow. • Which means 43% of Glasgow’s datazones are in the 15% most deprived • 4 in 5 datazones that moved out of 15% most deprived between 04 and 06 stayed out. • 4 in 5 datazones in most deprived 15% in SIMD 09 have been in on both SIMD 04 and SIMD 06
How to find out more - SIMD website www.scotland.gov.uk/SIMD
Quintile: splits SIMD into 5 groups each containing 20% of datazones (about 1,301 in each). Quintile 1 = 20% most deprived Decile: splits SIMD into 10 groups each containing 10% of datazones (about 651 in each) Decile 1 = 10% most deprived Vigintile: splits SIMD into 20 groups each containing 5% of datazones (about 325 in each). Vigintile 1 = 5% most deprived
Other information available… • General report with initial analysis • Technical report • Guidance leaflet • Interactive mapping website • Frequently Asked Questions • Income & employment domain annual updates • www.scotland.gov.uk/simd • More to come…
ANY QUESTIONS? Contacts • Jeremy Chan • Tel: 0131 244 3331 • jeremy.chan@scotland.gsi.gov.uk • Andrew White • Tel: 0131 244 7714 • andrew.white@scotland.gsi.gov.uk • Neighbourhood Statistics (SNS & SIMD) • Tel: 0131 244 0442 • neighbourhoodstatistics@scotland.gov.uk