Download

1 / 22
260 likes | 595 Views
Research Design. Methodology Part 1. Objectives. Qualitative Quantitative Experimental designs Experimental Quasi-experimental Non-experimental. Research Design. Plan for selecting subjects, research sites, and data collection procedures to answer research questions Credibility

E N D
Research Design Methodology Part 1
Objectives • Qualitative • Quantitative • Experimental designs • Experimental • Quasi-experimental • Non-experimental
Research Design • Plan for selecting subjects, research sites, and data collection procedures to answer research questions • Credibility • Extent to which results approximate reality, are accurate & trustworthy • Reduced error
Qualitative Design • Research where results are given in words • In depth understanding • Data collection • Observations • Interviews (open ended questions) • Documents • Identify patterns • Study behavior in the natural environment • Multiple realities, subjective • Example….
Quantitative Design • Research where results are given in numbers • Specifically designed instruments & statistics • Objectivity is critical • Use data from a sample to generalize to larger population • Look for: • cause & effect • relationships • describe, predict variables • Articles??
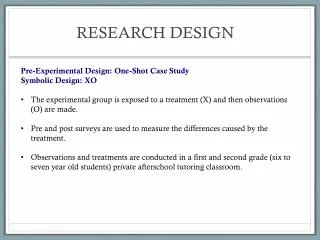
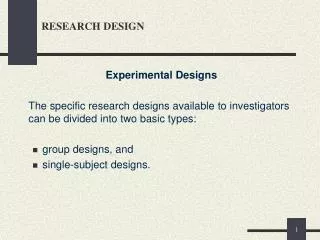
Experimental Design • Researcher manipulates what the subject(s) will experience • give treatments and observe/measureto see if they cause changes in behavior • Manipulate independent variables & measure dependent variables • True experimental design has randomly assigned treatment groups • Only difference in groups is due to chance
Experimental Designs R= Random N= Non-random O= Test/measurement T= Treatment Both groups measured at the same time Both groups measured at the same time Experimental group R Pre-test O1 Post-test O2 Treatment T Control group R Pre-test O3 Post-test O4 • Notations: • Post test only • R T O1 • Pre-test/post test • R O1 T O2 • R O3 O4
Experimental Designs • Strengths: • Random selection into groups…reduces error • Best approach for determining cause-and-effect relationships among variables • High degree of control of extraneous variables • Power of manipulation of variables • Weakness/limitation: • Experiments typically occur in laboratories • Difficult to replicate the “real world”
Quasi-Experimental Designs • Nonequivalent , non-random groups Pretest-Posttest Design • NA O1 TO2 NB O3O4 • Uses intact already established groups of subjects • IWU/ISU basketball • Classes • Selection can be a major problem if one group scores higher than the other because of a factor
Activity A researcher wants to test the effectiveness of 3 methods of teaching a dance to a group of 5th graders. A local PE teacher allows use of 3 of her classes. The researcher administers a pretest to all students, each class receives a different method of teaching for two weeks, and then all students get a posttest. What type of design is it? Experimental or quasi-experimental? Write out a design notation
Non-Experimental Designs Researchers measure subjects in order to describe them as they naturally exist without experimental intervention Don’t control/manipulate the environment
Non-Experimental Designs Relationships…when one variable varies systematically to another variable • Types of non-experimental Design • Descriptive • Comparative • Correlational
Non-Experimental Designs • Descriptive • Summarize the current or past status of something • Describe attitudes, behaviors, characteristics • Example • What are the leadership styles of Athletic Directors/Principals/Nonprofit CEOs • Attitudes of students towards campus rec/athletics
Non-Experimental Designs Longitudinal Alumni survey * Survey same alumni every 5 years Cross Sectional Alumni survey * Survey alumni who have been out 5, 10, 15 & 20 years one time. • Descriptive – 2 types • Longitudinal (over time) • Same cohort/group • Weaknesses: Subject attrition, time • Cross sectional (across groups) • Different groups of subjects over time • 20-25; 30-35; 40-45; 46+ • Weaknesses: Selection differences, time
Non-Experimental Designs • Comparative • Differences between 2+ groups • Value of the DV in 1 group is different than the value of the DV in the other group. • Public schools vs. private schools • D1 vs. D3 • Other examples…
Non-Experimental Designs • Is there a difference……. • in donations to athletic departments between public & private institutions? • in attitudes towards fitness between recreational volleyball players, baseball players, & softball players? • in fitness levels between youth who participate in structured and unstructured recess?
Non-Experimental Designs • Comparative • Difference or similarity conclusions can be made. • Causal conclusions can not be made.
Non-Experimental Designs • Correlational • Relationships (correlational analysis) • Gender & management style • Predictions (regression analysis) • Grad admissions criteria • Predictor variable – Undergrad GPA • Criterion variable – Grad GPA, GRE score • March Madness success • Predictor variables??
Non-Experimental Designs • Correlational • Correlation & Causation: never infer causation from correlation • High relationship does not mean one variable causes another • May be unmeasured variables affecting the relationship • Examples…
Non-Experimental Designs • Correlational • Measuring the relationship between variables • Correlation can be measured statistically • Pearson’s correlation coefficient (r) • Correlation coefficient (r) can range from –1 to 0 to 1 • Further from 0 = stronger relationship • -1/1 is a perfect negative/positive relationship • 0 means no relationship
Mixed Methods Designs Triangulation: reach the same conclusion using multiple methods • Utilize both qualitative & quantitative methods to triangulate research results • Sequential mixed methods • Begins with 1 methodology then uses the other to elaborate or expand findings • Delphi Study • Concurrent mixed methods • Use both methodologies at the same time & merge findings