Download
1 / 52
580 likes | 956 Views
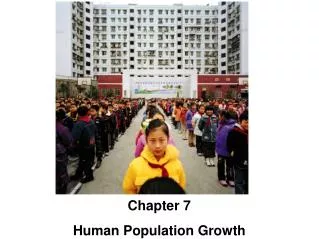
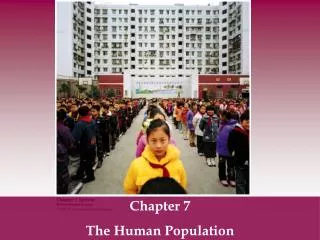
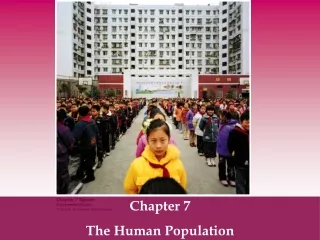
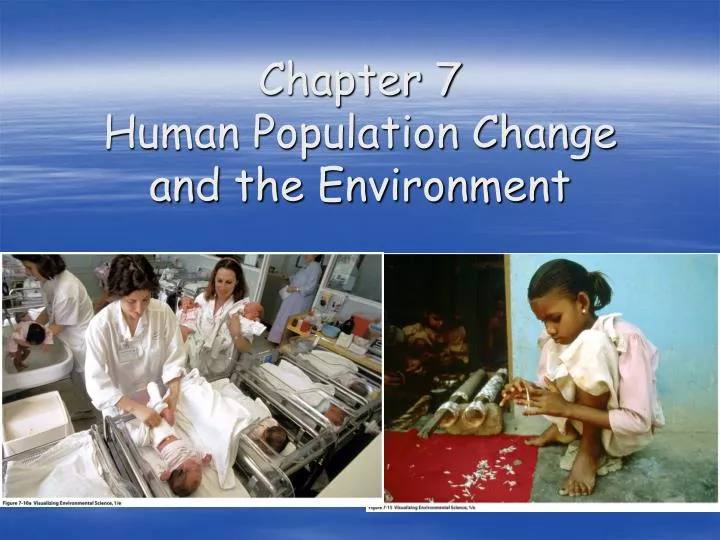
Chapter 7 Human Population Change and the Environment. Population Growth In China. Largest population in the world 1971: government involved 1979 More aggressive plan One-child policy Why do it?. Population Growth In China. 1984: program relaxed; why?

E N D
Population Growth In China • Largest population in the world • 1971: government involved • 1979 • More aggressive plan • One-child policy • Why do it?
Population Growth In China • 1984: program relaxed; why? • 1970: 5.8 children/woman • 2006: 1.7 children/woman • Ethical issues
India’s Population Pressures • World’s second most populous nation • 1.2 billion • 1950s - government sponsored family planning • Number of children per woman declined from 5.3 (1980) to 2.7 (2009) • Despite success • Population pressure has cause environmental degradation • 76% live under poverty level (less than $2 /day)
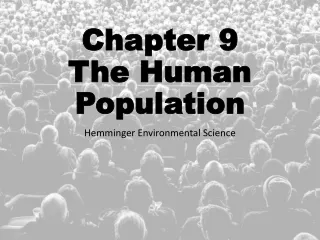
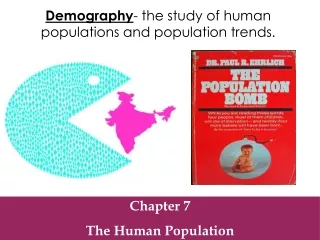
Population Ecology • Branch of biology • Study of populations • Individuals of a given species • How they respond to the environment • Look for similarities
How Populations Change • Global scale: dependent on two things • Birth rate (b) • Death rate (d) • Growth rate (r) • r = b - d
How Populations Change • Local populations • Dispersal • Immigration (i) • Emigration (e)
Population Ecology • Maximum Population Growth • Biotic Potential (maximum rate of increase under optimal conditions) • Life history characteristics: • Age at first reproduction • Reproductive fraction of life span • Number of reproductive periods/events • Number of offspring per reproductive event
America West Germany Africa 14 5 258 Average Number of Children, Grandchildren, and Great Grandchildren
Maximum Population Growth • Biotic potential • Maximum rate at which population can increase • Determined by life history characteristics • Large organisms ---> smallest biotic potentials • Microorganisms ---> largest biotic potentials
Exponential Population Growth • Optimal conditions • Constant reproductive rate • J-shaped curve
Environmental Resistance • Unfavorable environmental conditions • Prevent reproduction at biotic potential • Examples? • Environment controls population size: how?
Carrying Capacity • Largest population that can be sustained indefinitely • Changes in response to environment • J-shaped curve ---> S-shaped curve
Carrying Capacity • Populations are always changing • Slightly above or below carrying capacity • Too high ---> crash
Population Ecology • Environmental Resistance: • Environmental factors that limit the exponential growth of populations • Food, water, shelter, disease, predation, waste accumulation • As the environment deteriorates • population growth declines • death rate increases • The environment controls population size • As the population grows, so does environmental resistance, which limits population growth • Exponential growth is no longer possible
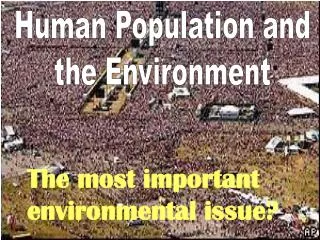
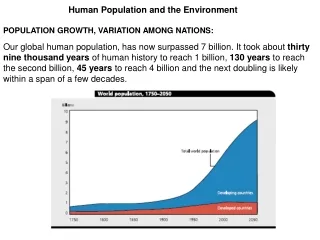
The Human Population • 7 billion by 2012 • Why the increase?
Thomas Malthus 1766-1834 • British economist • Hypothesized that human population would be kept in check: how? • Thinking shaped by rapid urbanization & industrialization • Was he correct?
Projecting Future Population • World growth rate has declined slightly • Zero population growth • Birth rate = death rate • End of 21st century • U.N. predicts 7.9-10.9 billion by 2050
Calculating Fertility Rates and Doubling Times (CBR – CDR)/10 = Rate of increase or decrease in population per 1,000 per year 70/Rate of Increase = Doubling Time
Earth’s Carrying Capacity • 4 billion – 16 billion people • Why such a large range? • What could happen to the environment? • Have we already exceeded our carrying capacity?
Demographics of Countries • Demographics: • Applied branch of sociology that deals with population statistics • Countries are grouped by • Population growth rates • Degree of industrialization • Relative prosperity • GNI PPP = gross national income in purchasing power parity • Per person GNI PPP = GNI PPP/number of people • The amount of goods and services an average citizen of a particular country could buy in the US
Demographics • Study of populations • Highly developed countries • Low birth rates • Low infant mortality • Longer life expectancies • High GNI PPP
Demographics • Less developed countries • High birth rates • High infant mortality • Shortest life expectancies • Low GNI PPP
Demographics of Countries • Highly Developed Countries • Lowest birth rates (some have shrinking pops) • Low infant mortality rates • Longer life expectancies • Highest per capita GNI PPP • Moderately Developed Countries • Higher birth and infant mortality rates • Medium industrialization • Lower GNI PPP • Less Developed Countries • Shortest life expectancies • Highest birth and infant mortality rates
Total Fertility Rate • TFR: average number of children born to each woman • Replacement rate = 2.1 • Current TFR = 2.6
Demographic Transition • Country moves from high birth and death rates to low birth and death rates • Four stages • Preindustrial • Transitional • Industrial • Postindustrial
What happens when a population reaches the 4th stage? • We don’t know: • We see that TFR are dropping as countries become more industrialized • Brazil • 1960 = 6.7 children/woman, 2010 = 2 • Worldwide • 1970 = 6.1 children/woman, 2010 = 2.7 • Despite great advances, population still increasing
Demographic Transition • Population is stabilizing in some countries • Can all developing countries get there?
Age Structure • Number and proportion of people in each age group in a population • Helps predict future growth • Shape is important • Pyramid = fast growth • Tapered bases = slow or negative growth
Future Population Growth • Determined by prereproductive individuals • Developed vs. developing countries
Stabilizing World Population • Dispersal is not a solution • Increase the death rate? • Reduce the birth rate!
Culture and Fertility • Gender and society • Different societies have different expectations; impacts fertility rates
Culture and Fertility • High TFRs may be traditional • High infant mortality rates • Children can work • Males more valued • Religious values • Changing traditions takes time
Status of Women • Gender inequality still exists • Most developing countries • More illiterate women • Fewer women attend secondary school • Limits women
Status of Women • Low status of women is single most important factor influencing TFR • Average age at marriage impacts TFR • Sri Lanka: 25; TFR = 2.0 • Bangladesh: 17; TFR = 3.0 • More education = less children; why?
Family Planning Services • Prenatal care, proper birth spacing • Healthier women ---> healthier babies ---> fewer infant deaths ---> lower TFR • Provide information and contraceptives • Local social and cultural beliefs
Government Policies & Fertility • Laws determining minimum marriage age • Budget for family planning, education, health care, old-age security • Economic rewards and penalties • Many countries recognize the problem
Population and Urbanization • Human population becoming more urbanized • 79% U.S. population lives in cities; why?
Population and Urbanization • Cities more heterogeneous • More young people in cities • Developing countries: more males in cities; why? • Developed countries: more females in cities; why?
Environmental Problems of Urban Areas • Encroachment into habitat • Brownfields • Long commute ---> more air pollution • Buildup of emissions • Paved roads, buildings affect water flow
Environmental Benefits of Urbanization • Compact development • Tall, multiple-unit residential buildings are close to shops and jobs • Connected by public transportation • Reduces pollution • Preserves rural areas • Requires smart planning!
Urbanization Trends • Currently ≈ 47% world’s population lives in urban areas • Most large cities are in developing countries • If urban growth is too fast, basic services cannot keep up