Download
1 / 47
480 likes | 908 Views
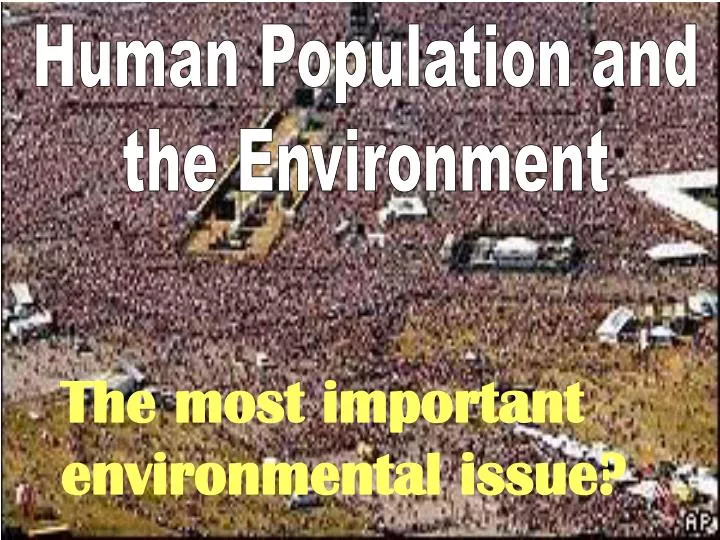
Human Population and the Environment. The most important environmental issue?. TOTAL. ENVIRONMENTAL. IMPACT. NUMBER OF PEOPLE. PER CAPITA. X. IMPACT. DEMOGRAPHY. The scientific study of the characteristics in the size and structure of human and non- human populations.

E N D
Human Population and the Environment The most important environmental issue?
TOTAL ENVIRONMENTAL IMPACT NUMBER OF PEOPLE PER CAPITA X IMPACT
DEMOGRAPHY The scientific study of the characteristics in the size and structure of human and non- human populations
HUNTERS AND GATHERERS Population: 250,000 to few million Low per-capita impact Minimal alteration of environment Growth rate: 0.00011% annually
EARLY, PREINDUSTRIAL AGRICULTURE 11,000 - 400 BP (~1600 AD) Domestication of plants and animals Settled villages Population: few - 500 million Annual Growth rate: 0.03%
INDUSTRIAL REVOLUTION ~1600 - 1965 Population: 500 million to 3 billion Disease prevention, vaccines, sanitation Enhanced food production, improved shelter Annual Growth rate of 2.1% by 1965 URBANIZATION
MODERN ERA 1965 - Present Rapid population growth in low income nations Annual growth now 1.2% URBANIZATION
Increasing our Carrying Capacity Figure 7.5
Population Density Figure 7.8
CRUDE GROWTH RATE = CRUDE BIRTH RATE - CRUDE DEATH RATE
Fertility rate Number of live births per 1000 women of childbearing age Age-specific fertility rate # of live births per 1000 women within a specified age range Total fertility rate # of children expected to be born to the average woman in her lifetime
(TFR) CRUDE FERTILITY RATE 10.5
Total Fertility Rate can be controlled • Quality education for both sexes and • womens’ empowerment • Social security for the aged • Access to contraception and family • planning • Quality health care and low infant • mortality rates • Urbanization (children in school)
Family Planning and TFR • Nations that invested in family planning (green) reduced TFRs more than similar nations that did not (red). Figure 7.17a
Female Education and TFR • Female literacy and school enrollment are correlated with total fertility rate: • More-educated women have fewer children. Figure 7.16
CANADA: Population Dynamics annually per 1000 10.5 Birth rate: 6.0 Migration: 7.7 Death rate:
US Population Dynamics 14.2 Birth rate: 3.4 Migration: 8.4 Death rate:
Latvia 8 Germany 9 Bulgaria 9 Slovenia 9 Estonia 9 Italy 9 Bosnia and Herzegovina 9 Slovakia 10 Ukraine 10 Greece 10 Austria 10 Russia 10 Belarus 10 Czech Republic 10 Belgium 10 Spain 10 Romania 10 Andorra 10 Croatia 10 Luxembourg 10 San Marino 10 Japan 10 COUNTRIES WITH LOW ANNUAL BIRTH RATE <10.5 live births per 1000 people
Niger 49 Mali 47 Afghanistan 47 Chad 47 Uganda 46 Somalia 46 Angola 45 Liberia 45 Democratic Republic of Congo 45 Burkina Faso 44 Malawi 44 Sierra Leone 43 Yemen 43 Benin 43 Guinea 42 Madagascar 42 Mauritania 42 Sao Tome and Principe 42 Djibouti 40 COUNTRIES WITH HIGH ANNUAL BIRTH RATE >40 live births per 1000 people
Malawi 24 Niger 23 Zambia 23 Swaziland 22 Ethiopia 21 Botswana 21 Zimbabwe 20 Namibia 20 Rwanda 20 Somalia 19 Mali 19 Uganda 18 Burkina Faso 18 Mozambique 17 Guinea 17 Burundi 17 Afghanistan 17 Sierra Leone 17 Tanzania 17 Western Sahara 17 Chad 17 COUNTRIES WITH HIGH ANNUAL DEATH RATE >16 deaths per 1000 people
For a live update, see: http://opr.princeton.edu/popclock/
Population growth rates, 1990-1995 Figure 7.3
China One Child Policy
Age structure: “Graying populations” • China’s aging population will mean fewer working-age citizens to finance social services for retirees. Figure 7.11c
Age structure: “Graying populations” • Demographers project that China’s population will become older over the next two decades. Figure 7.11a,b
Malnutrition has been a distribution problem What does the future hold?
Source: Committee for the National Institute for the Environment
Per-capita availability of Resources peaked in the 1960’s and 1970’s
Low income countries with a food deficit Source: FAO
HIV/AIDS and Human Population • Infects 1 in 5 people in southern African nations • Infects at least 5 million new people each year • Kills babies born to infected mothers • Has orphaned 14 million children • Has cut 15 years off life expectancies in parts of southern Africa • May inhibit demographic transition, leading to population Figure 7.27
POPULATION PYRAMID vs. INCOME Source: World Bank
What is the population lag effect? The population sometimes continues to rise after fertility falls below the replacement level, due to age distribution.
Age structure Figure 7.9
Age structure: Age pyramids • Canada (left) has a much slower growing population than does Madagascar (right). Figure 7.10
Poorer countries will experience most future population growth • 98% of the population increase will occur in developing nations Figure 7.20
The Wealth Gap • The richest 20% of the world’s people consumes 86% of its resources, and has >80 times the income of the poorest 20%. Figure 7.25