Download

1 / 73
730 likes | 741 Views
Understand the basic concepts of physics including distance, speed, time, acceleration, mass, and gravitational field strength. Learn formulas, calculations, and practical examples to grasp fundamental physics principles easily.

E N D
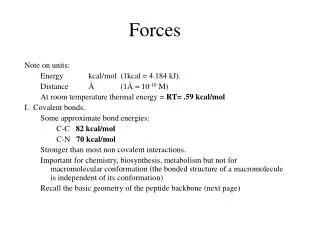
Distance, Speed and Time speed (m/s) = distance (m) time (s) S = D T D D = S X T T = D S x T S
An athlete runs 200m in 20s. What is his speed? • speed = distance • time • speed = 200 m • 20 s • speed = 10 m/s
A bus travels 2000m between stops at a speed of 40m/s. Find the time taken to travel this distance. • speed = distance • time • 40 = 2000 • time • time = 2000 • 40 = 50s
3. It takes a cyclist 30s to go 850 m. What is her speed? speed = distance time speed = 850 m 30 s speed = 28.33 m/s
A walker travels at 3m/s for a distance of 50m. How long did it take him? • speed = distance • time • 3 = 50 • time • time = 50 • 3 = 16.67 s
VELOCITY AND SPEED This car is travelling at a velocity of 20m/s east This car is travelling at a speed of 20m/s
Distance and Displacement Distance is simply how far something has moved Man and dog have walked 3 metres from X x Displacement is ‘distance in a given direction’ Man and dog have walked 3 metres WEST from X x
Acceleration acceleration (m/s2) = change in velocity (m/s) time taken (s) Remember: the formula for acceleration and deceleration is the same
What does acceleration mean? The rate at which speed increases e.g. 5 m/s2 5m/s/s The speed is increasing by 5m/s every second 0s 1s 2s 3s 4s 5s 6s 5m/s 10m/s 15m/s 20m/s 25m/s 30m/s
Questions on acceleration • A cyclist accelerated from rest to 10m/s in 5s. • Find the acceleration. • acceleration = change in velocity • time • = 10 – 0 = 10 • 5 5 • = 2 m/s2
A sprinter crosses the finishing line at a speed of 8m/s and comes to rest 10s later. Calculate the deceleration of the sprinter. • acceleration = change in velocity • time • = 8 – 0 = 8 • 10 10 • = 0.8 m/s2
A grand prix car increases its speed from 50m/s to 120m/s in 3s. What is the acceleration? • acceleration = change in velocity • time • = 120 – 50 = 70 • 3 3 • = 23.33 m/s2
4. A skier increases his speed from 6m/s to 10m/s in 2s. What is his acceleration? • acceleration = change in velocity • time • = 10 - 6 = 4 • 2 2 • = 2 m/s2
MASS 15 kg 50 kg Mass is the amount of matter inside an object. It is measured in kilograms (kg)
GRAVITATIONAL FIELD STRENGTH On Earth = 10N/kg g = 10
To find the WEIGHT of of an object you need to know the relationship between WEIGHT, MASS and GRAVITATIONAL FIELD STRENGTH weight (N) = mass (kg) x gravitational field strength (N/kg) = 1 x 10 = 10 N g = 10 1kg 1kg 10 N
Weight is the force of gravity on a body and is measured in NEWTONS (N). On Earth the force on a 1kg object is 10N (g = 10N/kg). On the moon the force on a 1kg object is 1.67N (g = 1.67N/kg) What is the weight of the Martian if it lands on the Earth or the Moon? 50kg
W M G To find the weight of the Martian you need to know:- weight (N) = mass (kg) x gravitational field strength (N/kg) W = M X G M = W G G = W M
Earth (g = 10) 50 kg weight = mass x g = 50 x 10 = 500 N
Moon ( g = 1.67) 50 kg Weight = mass x g = 50 x 1.67 = 83.5 N
STOPPING DISTANCE OF A VEHICLE Thinking distance Braking distance OVERALL STOPPING DISTANCE
Thinking distance Braking distance Stopping a vehicle Tiredness Alcohol Drugs Visibility Wet roads Icy roads Tyres/brakes worn out Driving too fast
Condition of road Condition of vehicle Stopping a vehicle brakes tyres type of road surface wet/icy roads alcohol/drugs Condition of driver concentration
Distance-Time Graphs 40 30 20 10 0 FASTEST Constant Speed Constant Speed Distance (metres) 20 40 60 80 100 Time/s Constant Speed At Rest
Distance-time graphs (outward/return journey) 40 30 20 10 0 Distance (metres) Time/s 20 40 60 80 100 return journey outward journey
Distance-time graphs (total journey time/total distance travelled) 40 30 20 10 0 Distance (metres) 40m 40m 80m Time/s 20 40 60 80 100 100s
Distance-time graphs (finding speed from part of graph) Distance-time graphs (finding speed from part of graph) 40 30 20 10 0 Distance (metres) Time/s 20 40 60 80 100 speed during 1st 20s = distance = 10m = 0.5m/s time 20s
Distance-time graphs (average speed for journey) Distance-time graphs (average speed for journey) 40 30 20 10 0 Distance (metres) Time/s 20 40 60 80 100 average speed = 80m = 0.8 m/s 100s
DISTANCE / TIME GRAPH 500m distance D 400m C B 300m 200m 100m (m) E A 10 20 30 40 50 60 70 80 90 100 110 110 120 130 140 0 Time (s)
Questions on Distance/Time Graph • Find: • the average speed during A-B • S = D = 300m = 15m/s • T 20s • the average speed between B – C • S = D = 0m = 0m/s • T 20s • 3. the average speed for the return journey • S = D = 460m = 7.67 m/s • T 60s
Speed/Time graphs 4 Speed (m/s) 0 5 Time (s) This object is travelling at a constant speed of 4m/s for 5s
Speed/time graphs (acceleration - increasing speed) speed 10 (m/s) 0 5 time (s) This object is increasing speed from 0m/s (rest) to 10m/s in 5s
Speed/time graphs (finding acceleration) speed 10 (m/s) 0 5 time (s) acceleration = change in velocity time = 10 – 0 5 = 2 m/s2
speed/time graphs (average speed) speed 10 5 m/s (m/s) 0 5 time (s) Average speed = 10 + 0 2 = 5 m/s
speed/time graphs (deceleration -decreasing speed) speed 20 (m/s) 0 5 time (s) This object is decreasing its speed from 20m/s to 0m/s (rest) in 5s
speed/time graphs (finding deceleration) speed 20 (m/s) 0 5 time (s) deceleration = change in velocity time = 20 – 0 5 = 4 m/s2
speed/time graphs (average speed) speed 20 10 m/s (m/s) 0 5 time (s) Average speed = 20 + 0 2 = 10 m/s
Speed/Time graph constantspeed accelerating 40 decelerating 30 accelerating VELOCITY (M/S) 20 constant speed 10 10 20 30 40 50 60 0 TIME (S)
What is the acceleration in the 1st 20s? Acceleration = change in velocity time = 30 – 0 20 = 1.5m/s2
What is the deceleration in the last 10s? deceleration = change in velocity time = 40 – 0 10 = 4m/s2
Speed/Time graphs (finding distance travelled) 4 area of the green rectangle Speed (m/s) 0 5 Time (s) distance = area under the graph distance = speed x time = height x length = 4 x 5 = 20m
speed/time graphs (distance travelled) speed 10 (m/s) 0 5 time (s) Area under graph = b x h 2 = 5 x 10 2 = 25 m
speed/time graphs (distance travelled) speed 20 (m/s) 0 5 time (s) Distance travelled = b x h 2 = 5 x 20 2 = 50 m
Speed/Time graph (finding distance travelled) 40 30 VELOCITY (M/S) 20 10 10 20 30 40 50 60 0 TIME (S)
What distance is travelled between 0s & 20s? 40 0 20 = 400m Area = b x h 2 = 800 2 = 20 x 40 2
What distance is travelled between 20s & 50s? 40 0 20 50 Area = b x h = 40 x 30 = 1200m
What distance is travelled between 50s & 60s? 40 0 50 60 = 10 x 40 2 Area = b x h 2 = 200m
Speed/Time graph (bigger the area under the graph ………..) 40 30 Bigger the area under the graph the further the distance travelled VELOCITY (M/S) 20 10 10 20 30 40 50 60 0 TIME (S)
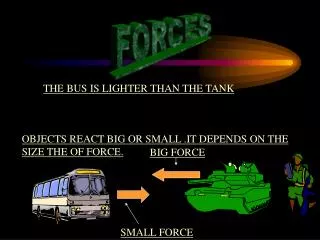
RESULTANT FORCES When 2 or more forces act on an object they can be replaced by a single force called the RESULTANT FORCE 6N 6N 12N