Download
1 / 9
90 likes | 113 Views
Explore the dynamics of the gas market, including US natural gas price trends, production statistics, industrial demand shifts, storage levels, and recent market events affecting industrial and power sectors. Gain insights into factors influencing gas and power prices, supply capacity, demand factors, and power price volatility in the East and West regions.

E N D
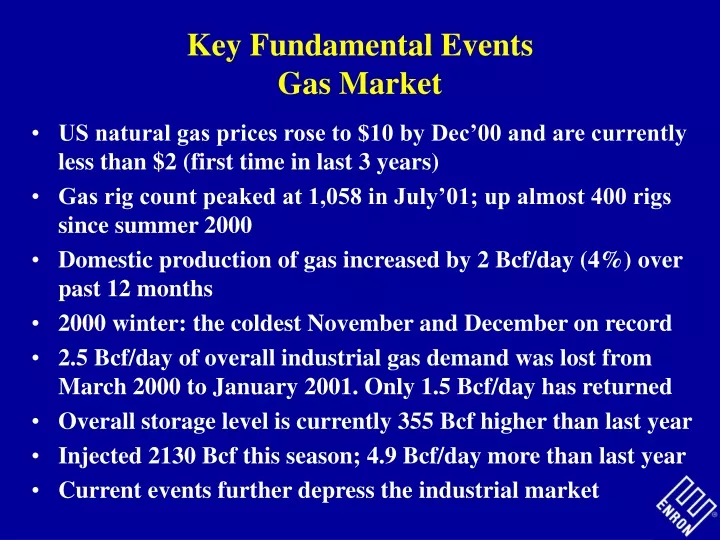
Key Fundamental EventsGas Market • US natural gas prices rose to $10 by Dec’00 and are currently less than $2 (first time in last 3 years) • Gas rig count peaked at 1,058 in July’01; up almost 400 rigs since summer 2000 • Domestic production of gas increased by 2 Bcf/day (4%) over past 12 months • 2000 winter: the coldest November and December on record • 2.5 Bcf/day of overall industrial gas demand was lost from March 2000 to January 2001. Only 1.5 Bcf/day has returned • Overall storage level is currently 355 Bcf higher than last year • Injected 2130 Bcf this season; 4.9 Bcf/day more than last year • Current events further depress the industrial market
Key Fundamental Events East Power • Supply Factors • - Additional generation capacity - 67,721 MW • - Nuclear generation up by 5.8% over 2000 – 4,364 MW • Demand Factors • - Lower than expected load growth – 1-2% actual vs. 4-5% forecast • - Slowing economy/ Industrial recession • Stabilizing prices
Key Fundamental EventsWest Power • Supply factors • - Additional generation capacity – 8,274 MW • - Nuclear utilization up 3.3% over 2000 - 2,343 MW • Demand • - Residential/Commercial incentive for conservation - 2,343 MW • - Industrial load shedding in Pacific Northwest – 1,511 MW • - Slowing economy • Stabilizing prices