Download
1 / 20
200 likes | 384 Views
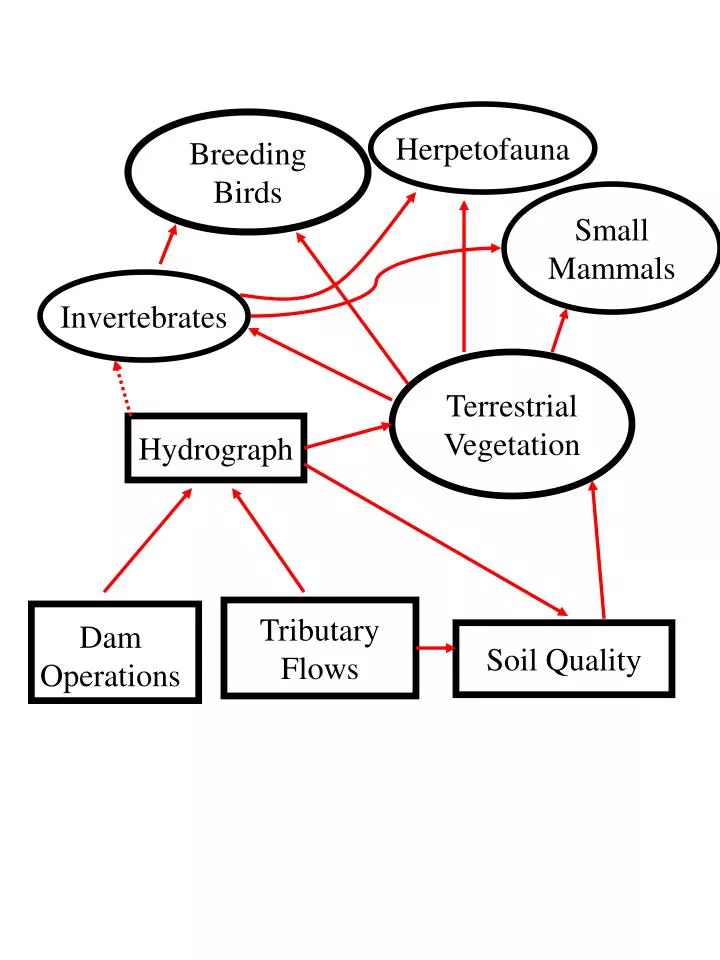
Herpetofauna. Breeding Birds. Invertebrates. Small Mammals. Terrestrial Vegetation. Hydrograph. Tributary Flows. Dam Operations. Soil Quality. Mammal rrichness x zone x reach. Mammal Abundance x zone x reach. Bird Richness per plot. Bird Abundance per plot.

E N D
Herpetofauna Breeding Birds Invertebrates Small Mammals Terrestrial Vegetation Hydrograph Tributary Flows Dam Operations Soil Quality
Mammal rrichness x zone x reach Mammal Abundance x zone x reach
Bird Richness per plot Bird Abundance per plot
Juvenile banded gecko from bug pitfall Modified funnel trap tested in 2001
May herp captures by zone (NHW / OHW only September herps by zone (NHW / OHW only)
Total Herps by zone – all canyon Herp Richness per zone by reach Herp abundance by zone by reach
Ground-dwelling arthropod responses to the three riparian zones.Values are presented as number of taxa or individuals per 0.235 m2 .
Ordination of arthropod pitfall community data. Open 0 OHW, Closed = NHW, Crosshairs = WAT
TVV x zone by reach for transects Richness x zone by reach for transects Bird patch ordination – zonal differences
Veg transect ordination. Open = OHW, Closed = NHW, Crosshairs = WAT
Total vegetative cover by stage elevation Plant species richness by stage elevation Diversity (H’) by stage elevation
Wetland Indicator score by stage elevation NMDS ordination by zone – summarized by mean and SD of plot scores
Bird Abundance and Richness by TVV / bird patches Vegetation and bird community ordinations from the bird patches
Mammal richness and abundance by TVV per zone in integrated sites Invertebrate richness and abundance versus TVV in integrated sites
Simultaneous ordinations of vegetation and insect data from transects
Abundance and richness of faunal components by reach and zone
Vegetation abundance and richness in bird patches, transects, and dynamics sites