Download
1 / 20
220 likes | 497 Views
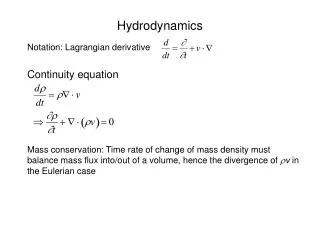
SLURRY BUBBLE COLUMN HYDRODYNAMICS. - Progress Report - Novica S. Rados Department of Chemical Engineering, CREL Washington University, St. Louis. April 12, 2001. CHEMICAL REACTION ENGINEERING LABORATORY. Motivation and Objectives.

E N D
SLURRY BUBBLE COLUMN HYDRODYNAMICS - Progress Report - Novica S. Rados Department of Chemical Engineering, CREL Washington University, St. Louis April 12, 2001
CHEMICAL REACTION ENGINEERING LABORATORY Motivation and Objectives • Slurry bubble columns are frequently used type of chemical reactors. They mostly operate in churn turbulent regime and at high pressure. • There is a lack of experimental data on slurry bubble columns operated at these conditions. • Develop a new CARPT calibration apparatus and scanning procedure that can be used for thick wall high pressure metal vessels. • Develop a more robust CARPT tracer particle position reconstruction algorithm that can more accurately resolve arches and other “imperfections” of the CARPT calibration (count vs. distance) curves. • Acquire CARPT experimental data of a slurry bubble column operated at a wide range of gas velocities and pressures.
axial dir. stepper motor theta dir. stepper motor lead screw rod sprocket needle bearing high pressure seals 8:1 gear box PVDF guides tripod CHEMICAL REACTION ENGINEERING LABORATORY CARPT Calibration Device tracer particle holding rod ass.
solid angle wall path detector crystal CHEMICAL REACTION ENGINEERING LABORATORY CARPT Calibration Calibration yields count vs. distance curve counts = f (distance, solid angle, wall path, medium) Threshold = 45 mV Compton Scattering Photo peaks threshold Build-up problems
CHEMICAL REACTION ENGINEERING LABORATORY Spectrum Stability Acquisition of the photo peak fraction of the spectrum using a high threshold Gupta: Spectrum = f (distance) Stability of the Spectrum ? Spectrum f (source strength) Rammohan: Spectrum = f (time) & • Spectrum shifted slightly only when: • distance was changed for more than 2 ft. • order of magnitude weaker particle was used • gain wasn’t tuned over several days required nearly ideal conditions
CHEMICAL REACTION ENGINEERING LABORATORY Calibration Curve G-L: Ug=30cm/s Det #7 Threshold = 600 mV Detectors well aligned and further away Detector alignment and pile-up problems
Pile Up Limitations CHEMICAL REACTION ENGINEERING LABORATORY When using the photo peak fraction of the spectrum CMax < 1000 Pile up: Detectors are unable to count all incoming photons + Distorted Spectrum + + Well Shaped Spectrum + Detectors too close ! Detectors further away ! detector crystal
CHEMICAL REACTION ENGINEERING LABORATORY Laser Detector Alignment • - Posts not firm enough => middle detectors can vibrate / move • Angles between detectors not 45o => mismatched particle/detector positions All detectors are within 5 degrees
Det #3 G-L: Ug=30cm/s CHEMICAL REACTION ENGINEERING LABORATORY CARPT - Error Analysis assumed power law dependency error in counts = std. distribution => => signal to noise ratio source strength, sampling time => weighing function exact error depends on the algorithm and the number of used detectors
Particle Position Reconstruction Algorithm CHEMICAL REACTION ENGINEERING LABORATORY Degaleesan 1. Find distance using qubic spline fit of the calibration curve. Determine particle location using least square approach. 2. Find distance using quadratic fit of all calib. points at a single level. Determine particle location using least square approach. Rados 1. Find distance using beta spline fit of the calibration curve. Determine particle location using least square approach. 2. Find distance using power law fit of the several surrounding calib. points. Determine particle location using least square approach. Step 1. Step 2. Step 2. improvement • Disadvantages • Only one z level considered • Far points on the same level • unnecessarily considered
CHEMICAL REACTION ENGINEERING LABORATORY Local Power Law Fitting Distance, cm Counts
CHEMICAL REACTION ENGINEERING LABORATORY Position Reconstruction G-L Ug=30cm/s Rados’ method: more spurious points (using less det.) better centered islands comparable size of the islands to Degaleesan
CHEMICAL REACTION ENGINEERING LABORATORY Position Reconstruction G-L Ug=30cm/s off center ~ 4 (9) mm off center < 3 mm fr ~ 7.5 (10) mm fr ~ 7.5 mm fq < 15 mm fq < 13 (18) mm fz ~ 10 (30) mm fz < 5 mm
Detector #30 (X) Distance, cm Counts CHEMICAL REACTION ENGINEERING LABORATORY Ong: G-L Ug=30cm/s Calibration Curve - G-L Beta-Spline Fitting
CHEMICAL REACTION ENGINEERING LABORATORY Position Reconstruction - G-L Ong: G-L Ug=30cm/s off center < 6 mm off center < 2 mm fr ~ 6 mm fr < 5 mm fq < 9 mm fq < 5 mm fz ~ 10 mm fz < 3 (5) mm
CHEMICAL REACTION ENGINEERING LABORATORY Calibration Curve - Slurry G-L-S Ug=45cm/s Detector #30 (X) ring 3: r = 7.62 cm ring 0, 1, 2: r = 0, 2.54, 5.08 cm Arches are caused by the wall and solids (wall path) (medium)
CHEMICAL REACTION ENGINEERING LABORATORY Position Reconstruction - Slurry G-L-S Ug=45cm/s off center ~ 6 (20) mm off center < 3.5 (6) mm fr < 10 (20) mm fr < 7 mm fq ~ 10 mm fq < 7 (10) mm fz ~ 10 (30) mm fz ~ 3 (10) mm
CHEMICAL REACTION ENGINEERING LABORATORY CARPT Slurry Experiments Modifications 1. Tripoid redesigned 2. Det. changed 3. Plate redesigned 4. Det. moved closer 5. Gear box added 6. Rod guides added
CHEMICAL REACTION ENGINEERING LABORATORY CARPT Slurry Experiments
CHEMICAL REACTION ENGINEERING LABORATORY Conclusion and Future Work • Developed automated CARPT calibration device, detector alignment, photo peak scanning procedures and position reconstruction algorithm enable acquisition of CARPT experiments even in thick wall high pressure metal vessels. • Process the acquired experimental data. - reconstruct the tracer particle (x,y,z) positions - filter the positions - process the velocities - process the “turbulent parameters” (stresses & TKE) - process the eddy diffusivites • Finish the DP experiments and finish processing holdup profiles.