Download
1 / 21
210 likes | 233 Views
Learn about frequency, histograms, data distribution shapes, outliers, cumulative frequency, EDA, and graphical displays in statistics. Discover how to interpret data through bar graphs, Pareto charts, circle graphs, stem-and-leaf plots, and time-series graphs. Practice critical thinking to analyze data patterns and outliers effectively.

E N D
Chapter 2 Organizing Data Understandable Statistics Ninth Edition By Brase and Brase Prepared by Yixun Shi Bloomsburg University of Pennsylvania
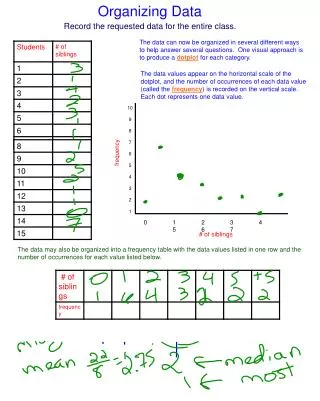
Frequency and Relative Frequency Class Frequency Class width Lower class limit, upper class limit, and midpoint Tally data
Frequency and Relative Frequency Class boundaries for integer data Frequency table Relative frequency Relative frequency table Frequency histogram Relative frequency histogram
Distribution Shapes Symmetric – The distribution’s shape is generally the same if folded down the middle.
Distribution Shapes Uniform or rectangular (also symmetric)
Distribution Shapes Skewed Left
Distribution Shapes Skewed Right
Distribution Shapes Bimodal
Critical Thinking A bimodal distribution shape might indicate that the data are from two different population. Outliers – data values that are very different from other values in the data set. Outliers may indicate data recording errors.
Cumulative Frequency Tables Cumulative frequencies for a class are the sums of all the frequencies up to and including that class. Example
Ogives Graph that displays cumulative frequencies
Exploratory Data Analysis EDA is the process of learning about a data set by creating graphs. EDA specifically looks for patterns and trends in the data. EDA also identifies extreme values.
Graphical Displays Represent the data Induce the viewer to think about the substance of the graphic Avoid distorting the message of the data
Bar Graphs Used for qualitative or quantitative data Can be vertical or horizontal Bars are uniformly spaced and have equal widths. Length/height of bars indicate counts or percentages of the variable. Including titles and units and labeling axes are good practices.
Pareto Charts A bar chart with two specific features: Heights of bars represent frequencies. Bars are vertical and are ordered from tallest to shortest.
Circle Graphs/Pie Charts Used for qualitative data Wedges of the circle represent proportions of the data that share a common characteristic. Including a title and legend is a good practice.
Time-Series Time-Series Data – Measurements of the same variable for the same individual over regular intervals of time. Time-Series Graphs
Critical Thinking – which type of graph to use? Bar graphs are useful for quantitative or qualitative data. Pareto charts identify the frequency in decreasing order. Circle graphs display how a total is dispersed into several categories. Time-series graphs display how data change over time
Stem and Leaf Plots Displays the distribution of the data while maintaining the actual data values. Each data value is split into a stem and a leaf.
Critical Thinking By looking at the stem-and-leaf display “sideways”, we can see the distribution shape of the data. Large gaps between stems containing leaves, especially at the top or bottom, suggest the existence of outliers. Watch the outliers – are they data errors or simply unusual data values?