Download
1 / 14
140 likes | 251 Views
Redesigning General Chemistry at the University of Arizona: How to engage students?. Steve Brown, Gail Burd, John Enemark, Anne Padias, John Pollard, Vicente Talanquer, Wayne Wesolowski, Vicki Wysocki. The PLAN: Large lecture discussion sections abolished

E N D
Redesigning General Chemistry at the University of Arizona: How to engage students? Steve Brown, Gail Burd, John Enemark, Anne Padias, John Pollard, Vicente Talanquer, Wayne Wesolowski, Vicki Wysocki
The PLAN: • Large lecture discussion sections abolished • Replaced by discussions in the lab environment, max 24 students • TAs use the same guiding PowerPoint presentation (with notes) • Small learning/discussion units of 4 students • Concepts immediately reinforced by experimentation • Progression of a lab: • introduction of problem • background discussion (let’s think) • experiment (let’s explore) • conclusion (let’s think) • etc.
Lab units operate this way: • Students belong to a peer group of 4 students (one bench) • Lab start by introducing the QUESTION • The question is related to the lecture subjects • The students have to define the parameters of the experiment • They have to discuss options in their groups • They shuttle back and forth between “class” and “lab” • They have to discuss the results at the end of the lab
Week 5 Making Light Efficiently • Today’s Agenda: • Review understanding of light. • Develop the day’s problem. • Perform the first challenge: measure the light emitted by an incandescent light bulb. • Analyze results: determine the amount of light generated at different wavelengths. Determine the amount of energy generated at different wavelengths. • Perform the final challenge: measure the light emitted by other light sources. • Analyze results: determine the amount of light and energy generated at different wavelengths. • Secondary analysis: compare light generated to power required. • Final analysis: draw conclusions.
The chemistry of green Why would someone say that the 21st century must be the “Green Century”?
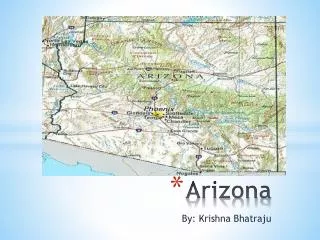
Global Warming Why the concern?
The efficiency of a light source is a measure of the amount of energy produced as visible light compared to the total energy emitted: efficiency = visible light energy / total energy What do you understand by efficiency? How would you express the efficiency of a light source?
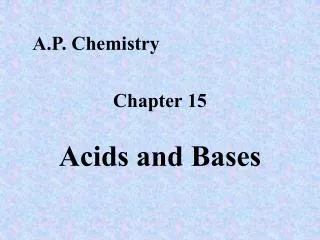
Electromagnetic Spectrum Consider this source of light. What other forms of energy are produced, besides visible light?
Let′s think! In your groups: • Predict what you think graphs of light intensity versus wavelength for an “ideal” light source and an incandescent light bulb will look like. • Based on the graphs, propose a strategy to determine the efficiency of the light emitted by a light source. • What will you need to make this determination? .
A spectrometer is an optical instrument that allows us to measure the amount of light (number of photons) as a function of wavelength. The instrument essentially counts the number of photons hitting the detector in a specific period of time.
Let′s explore! Your First Challenge Obtain a graph (spectrum) of the light output of an incandescent light bulb. Save the spectrum and load it into a spreadsheet program. Learn how to use the spectrometer. • Available resources: • an incandescent light bulb, • an Ocean Optics Spectrometer. You have 45 minutes
Let′s think! • Create a graph of your spectral data. • Compare this spectra to your prediction. Discuss with your group any differences. • Using the spectral data determine the fraction of light emitted by the incandescent light bulb that falls in the visible region. Record your results for this fraction on the board.
Let′s think! Economic efficiency • For each source compare the light emitted in the visible region with the power rating (wattage) for that source. • Discuss the results with your group. Are they what you expected?
No Report In lieu of a report your group is to generate a results presentation and answer a few discussion questions. Completion of this activity will be counted as the equivalent of another pre-lab activity. You will also be held responsible for this material on the exams. No report is required for this experiment.