Download
1 / 25
250 likes | 363 Views
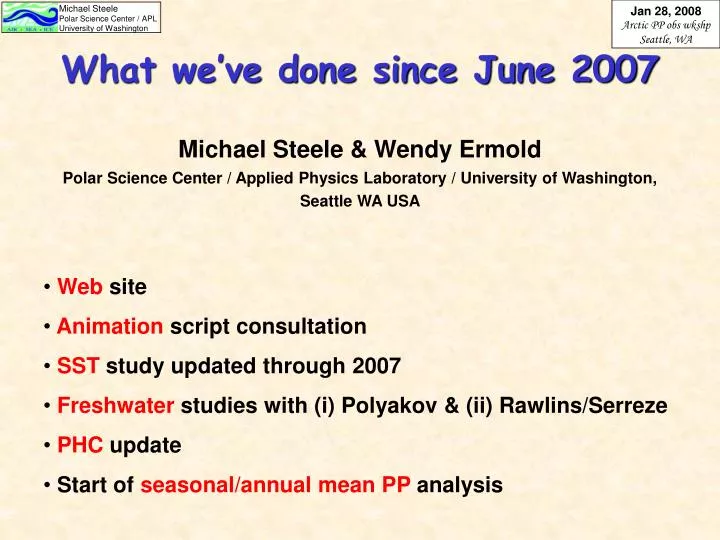
What we’ve done since June 2007. Michael Steele & Wendy Ermold Polar Science Center / Applied Physics Laboratory / University of Washington, Seattle WA USA. Web site Animation script consultation SST study updated through 2007 Freshwater studies with (i) Polyakov & (ii) Rawlins/Serreze

E N D
What we’ve done since June 2007 Michael Steele & Wendy Ermold Polar Science Center / Applied Physics Laboratory / University of Washington, Seattle WA USA • Web site • Animation script consultation • SST study updated through 2007 • Freshwater studies with (i) Polyakov & (ii) Rawlins/Serreze • PHC update • Start of seasonal/annual mean PP analysis
? ? ? ? ? ? ? ? ? People
Graphics How to organize our new synthetic plots?
Data How to organize our new synthetic DATA?
Outreach Animation…
Links • Others? • Announcement on ArcticInfo?
Private Section Username: mas Password: st33l3
Animation: 1:30 pm today • SST study: • Refresher on bias & binning issues/techniques • Updated through 2007 • …using satellite data & model output
SPATIAL BIAS Example: East Siberian + eastern Laptev Seas Raw Data 50km bin averaged Mean SST = 2.2 C Mean SST = 1.9 C sparse COLD profiles dense WARM profiles Temperature (ºC) PP binning: getting done!
data cold warmer hot Fake trends Year 1 Year 3 Year 2 steady state ocean spatially biased sampling fake regional-average warming trend Solution: subtract out the mean spatial field Trend analysis: still to do
Mean summer (Jul-Aug-Sep)Sea Surface Temperature (SST)(0-10 m) Beaufort-W World Ocean Database ’05 (in situ data) summer 50 km bins
recent warming recent warming recent warming 3.25 std dev 3.05 std dev insitu WOD’05 Summer (jul/aug/sep)SST trends:regional anomalies satellite Reynolds et al smoothed summer SST (C) mean = 2.7°C mean = 0.4°C (a) Beaufort-E (b) Beaufort-W summer SST (C) mean = 5.9°C mean = 2.3°C (c) Bering St (d) ESS+ Laptev summer SST (C) mean = 2.9°C mean = 3.1°C (f) Chukchi (e) Kara Is warming starting to matter to PP?
Ocean heat fluxes: summer 2007 (Jul-Aug-Sept) …using Jinlun Zhang’s ice-ocean model Lateral heat flux convergence Surface heating (Fsw) ice ice Chukchi + w. Beaufort Everywhere! ocean currents are important north of Alaska but most places, it’s solar heating
Freshwater studies Terrestrial P-E incr. ’96/’97 Lake discharge incr. ’98 Mackenzie R. River discharge incr. ’96 – ‘98 24% fresher with variable river discharge Sea ice melt decr. ’97/’98 Beaufort gyre FW incr. ’97-’02 Ocean shelf FW incr. ’96 • Polyakov et al. • …in press • Russian shelf anomalies are: • (a) out of phase with central Arctic Ocean • (b) much smaller than central Arctic Ocean anomalies (2) Rawlins et al. …in prep.
PHC update • Fram Strait / EGC • Bering St / • Siberian shelves • MLD lobes …later …in progress…
Seasonal/annual mean PP analysis …later…
Ongoing: • Update our T, S data base • with data from 1990s & 2000s • Barely started: • MLD/stratification temporal change study
0 model obs • But! • Model’s • heat content • underestimated? Depth (m) 50 Beaufort Slope (70.8°N, 140°W)Aug 1, 2007 SST + MLD = heat content overestimate 100 2 4 -2 0 Temperature (°C) Maybe not everywhere… Heat content uncertainty Chukchi Borderland(75.7°N, 156°W)Aug 7, 2007 satellite SST model 0 XCP 50 Depth (m) 100 0 2 4 -2 Temperature (°C) • Conclusions: • Ocean transport < shortwave …probably • Need further analysis of the in situ IPY data! Courtesy of J. Morison, F. McLaughlin, A. Proshutinsky
Temperature (ºC) WOD’05data distribution,colored by: Temperature Years Earliest Year 0-10 m July, Aug, Sept
Temporal Bias Raw data histograms
^ The solution: Multiple Regression T = a + bx + cy + dPHC(x,y) + eyear spatial field Anomalies are defined relative to the mean spatial field over a given time period. …no “intra-year” predictor
2007: What a year! Max Anom 5°C Temperature Anomaly (C) July-Aug-Septsatellite SSTanomalies(rel to 1982-2007) 2000 2001 2002 1982-2007: boring! 2005 2004 2003 2006 2007 Sept 16
lateral heat flux convergence net ocean heating How much warming is from ocean transport? fadv Russia ice 20-30% 100% Alaska -1 -0.5 0 +0.5 +1 Jul-Aug-Sep 2007 fadv