Download
1 / 26
270 likes | 436 Views
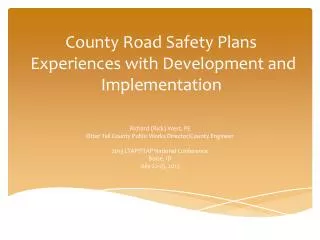
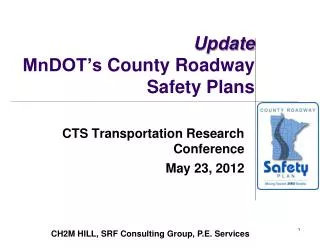
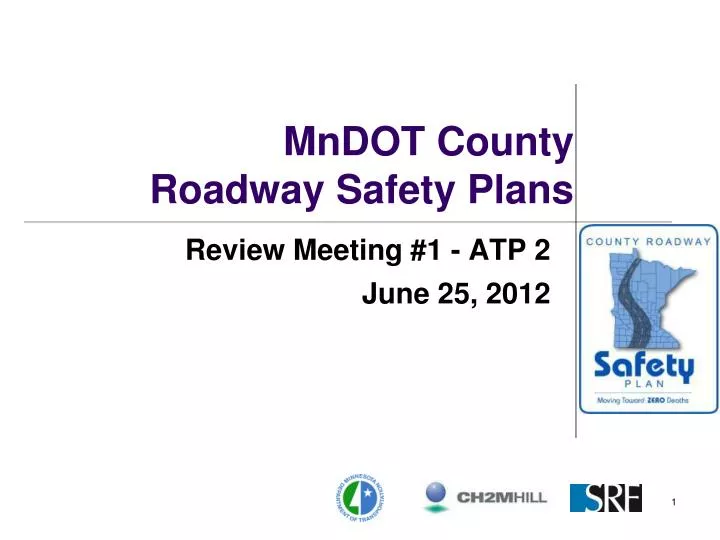
MnDOT County Roadway Safety Plans. Review Meeting #1 - ATP 2 June 25, 2012. Agenda. Introductions Data Overview State & ATP Level County level Safety Emphasis Areas Safety Strategies Workshop Logistics Date, location Sample agenda, invitation, invite list Safety Strategies.

E N D
MnDOT County Roadway Safety Plans Review Meeting #1 - ATP 2 June 25, 2012
Agenda • Introductions • Data Overview • State & ATP Level • County level • Safety Emphasis Areas • Safety Strategies Workshop • Logistics • Date, location • Sample agenda, invitation, invite list • Safety Strategies 6/25/2012
Project Approach – Phase III June 2012 April 2012 April 2012 July 2012 Develop Comprehensive List of Safety Strategies Crash Analysis Select Safety Emphasis Areas Safety Workshop June 2012 Kick-off Video Meeting Review Mtg w/ Counties Project Programming Project Development Implementation Evaluation Refinement & Update SHSP Oct 2012 Identify Short List of Critical Strategies Identify Safety Projects Nov 2012 Sept 2012 January 2013 Safety Plan 6/25/2012
ATP 2 Severe Crash Numbers Legend 10/yr (50 total) - Severe crashes on any jurisdiction 4/yr (20 total) - Severe crashes on CSAH/CR MnCMAT Crash Data, 2007-2011 Severe = K (fatal) + A (life-changing injury) 2/yr (11) 1/yr (3) 2/yr (14) 2/yr (11) 1/yr (5) 1/yr (4) 3/yr (16) 1/yr (4) 5/yr (26) 2/yr (11) 1/yr (8) 1/yr (4) 15/yr (76) 6/yr (31) 14/yr (73) 6/yr (32) 4/yr (21) 1/yr (8) 3/yr (17) 2/yr (10) 8/yr (42) 4/yr (20) 6/25/2012
ATP 2 – Safety Emphasis Areas 6/25/2012
Greater Minnesota Crash Data Overview Source: MnCMAT Crash Data, 2006-2010 Severe is fatal and serious injury crashes (K+A). 5 Year Crashes 156,182 4,902 -ATP’s 1, 2, 3, 4, 6, 7, and 8 – NO Metro Example All – % Severe – % CSAH/CR 36,716 – 24% 1,963 – 40% State System 70,808 – 45% 2,000 – 41% City, Twnshp, Other 48,658 – 31% 939 – 19% Urban 14,086 – 38% 337 – 17% Rural 22,630 – 62% 1,626 – 83% Not Animal 18,616 – 82% 1,566 – 96% Animal 4,009 – 18% 60 – 4% Unknown/Other 1,577 – 11% 17 – 5% Not Inters-Related 5,177 – 37% 175 – 52% Inters-Related 7,332 – 52% 145 – 43% Unknown/Other 1,276 – 7% 61 – 4% Inters-Related 5,487 – 29% 463 – 30% Not Inters-Related 11,849 – 64% 1,042 –66% Run Off Road – 1,202 (23%), 69 (39%) Head On – 366 (7%), 27 (15%) “Other” – 540 (10%), 25 (14%) Rear End – 1,336 (26%), 17 (10%) Other/Unknown 2,600 – 47% 228 – 49% Signalized 209 – 4% 4 – 1% All Way Stop 164 – 3% 15 – 3% Thru-Stop 2,511 – 46% 216 – 47% Head On, SS Opp. 751 – 6% 132 – 13% Run off Road 7,891 – 67% 675 – 65% Signalized 2,308 – 31% 32 – 22% All Way Stop 445 – 6% 5 – 3% Thru-Stop 2,697 – 37% 65 – 45% Other/Unknown 1,881 – 26% 43 – 30% Run Off Road – 999 (38%), 95 (42%) Right Angle – 268 (10%), 39 (17%) “Other” – 303 (12%), 29 (13%) Head On – 112 (4%), 21 (9%) On Curve 247 – 33% 46 – 35% On Curve 3,222 – 40% 339 – 50% Right Angle – 633 (27%), 15 (47%) Rear End – 799 (35%), 5 (16%) Left Turn – 375 (16%), 5 (16%) Head On – 100 (4%), 4 (13%) Right Angle – 1,268 (47%), 37 (86%) “Other” – 252 (9%), 9 (21%) Left Turn – 268 (10%), 4 (9%) Rear End – 333 (12%), 3 (7%) Right Angle – 849 (34%), 122 (56%) “Other” – 464 (18%), 33 (15%) Run Off Road – 342 (14%), 21 (10%) Left Turn – 184 (7%), 10 (5%) 6/25/2012
ATP 2 Crash Data Overview 5 Year Crashes ATP 2 7,072 295 Example All – % Severe – % Source: MnCMAT Crash Data, 2007-2011 -- Severe is fatal and serious injury crashes (K+A). CSAH/CR 1,571 – 22% 136 – 46% State System 3,761 – 53% 128 – 43% City, Twnshp, Other 1,740 – 25% 31 – 11% Urban 326 – 21% 9 – 7% Rural 1,245 – 79% 127 – 93% Not Animal 1,064 – 85% 121 – 95% Animal 181 – 15% 6 – 5% Non Ped/Bike 324 – 99% 8 – 88% Ped/Bike 2 – 1% 1 – 12% Unknown/Other 128 – 12% 10 – 8% Inters-Related 292 – 27% 38 – 31% Not Inters-Related 644 – 61% 73 – 60% Unknown/Other 78 – 24% 1 – 13% Not Inters-Related 117 – 36% 5 – 62% Inters-Related 129 – 40% 2 – 25% Other/Unknown 141 – 48% 11 – 29% Signalized 6 – 2% 0 – 0% All Way Stop 4 – 1% 0 – 0% Thru-Stop 141 – 48% 27 – 71% Run Off Road – 34 (29%), 3 (60%) Rear End – 29 (25%), 1 (20%) SS Opp. – 7 (6%), 1 (20%) Right Angle – 11 (9%), 0 (0%) Right Angle – 43 (30%), 15 (56%) “Other” – 37 (26%), 8 (30%) Rear End – 16 (11%), 1 (4%) Signalized 8 – 6% 0 – 0% All Way Stop 2 – 2% 0 – 0% Thru-Stop 76 – 59% 2 – 100% Other/Unknown 43 – 33% 0 – 0% Run Off Road – 46 (33%), 5 (45%) Head On/SS Opp – 9 (6%), 2 (18%) Right Angle – 9 (6%), 2 (18%) • Rear End – 20 (14%), 0 (0%) Head On, SS Opp 45 – 7% 11 – 15% Run off Road 414 – 64% 45 – 62% Right Angle – 36 (47%), 1 (50%) “Other” – 9 (12%), 1 (50%) Rear End – 7 (9%), 0 (0%) Left Turn – 6 (8%), 0 (0%) Rear End – 12 (28%), 0 (0%) Right Angle – 9 (21%), 0 (0%) Run Off Road – 8 (19%), 0 (0%) Left Turn – 4 (9%), 0 (0%) On Curve 11 – 24% 3 – 27% On Curve 134 – 32% 18 – 40% 6/25/2012
Data Gathering • Thank you for responding to Ann’s request for information. Information as of 6/13/2012 6/25/2012
Workshop Schedule Coordinator 6/25/2012
Safety Workshop Objective: Multidisciplinary discussion of a short list of safety strategies (Note: there is no discussion of specific locations.) • Agenda • 8:30 – Coffee and Registration • 9AM – Introductions • Presentations – Law Enforcement and/or Local Safety Advocates • Background Information/Desired Outcomes • Breakout Sessions – Prioritize Strategies • 12PM – 1PM - Lunch • Report Back/Final Presentation • 2:45 – 3PM - Wrap-up 6/25/2012
Safety Workshop – County Assignments • June • Group Coordinator - Secure Location and Caterer • 50-100 people • $12/person (“all in” including delivery, tax and tip) • Send invites (examples have been provided) • July • Group Coordinator - Confirm final headcount (10 days prior to workshop) • Group Coordinator - Email Carla Stueve (SRF) cstueve@srfconsulting.com • Confirm Audio-visual availability for the workshop 6/25/2012
Sample List of Attendees: Law Enforcement State patrol, sheriffs and police chiefs EMS Providers Ambulance, first responders and emergency room staff Politicians County board members, city council members, state representatives Local Agency Staff County engineers, city engineers, county health representatives Tribal Representatives Safe Communities Folks Judges and Attorneys Advocacy Groups MADD, AARP, Bicycle, Safe Routes to School MnDOTStaff Safety Workshop 6/25/2012
Safety Strategies Overview NCHRP Report 500 • A series of guides to assist state and local agencies in reducing injuries and fatalities in targeted emphasis areas • The guides correspond to the emphasis areas outlined in the AASHTO Strategic Highway Safety Plan. • Each guide includes a brief introduction, a general description of the problem, the strategies/ countermeasures to address the problem, and a model implementation process. 6/25/2012
Screening - Initial Strategies AASHTO’s SHSP, NCHRP Report 500 Implementation Guidelines, and input from Safety Partners. The strategies will be screened using: - Crash data, - Effectiveness, - Cost, and - Input from Safety Workshop. The selected Critical Strategies should have the greatest potential to significantly reduce the number of traffic fatalities in your County. Intersections 30 Strategies Road Departure 8 Strategies Young Drivers 2 Strategies Seat Belts 3 Strategies Alcohol/Drug 9 Strategies Workshop’s Critical Strategies Enforcement Strategies Education Strategies Engineering Strategies EMS Strategies 6/25/2012
List of Road Departure Strategies 6/25/2012
Example – Typical Intersection Strategies Included Strategies: Street Lighting Change Intersection Type Dynamic Warning Signs Indirect Turns Enhanced Signing and Delineation Improve Sight Distance 6/25/2012
List of Young Driver Strategies 6/25/2012
List of Impaired Driving Strategies 6/25/2012
Phase I, II & III - Workshops Voting Results 6/25/2012
Project Development Process - Example $65M worth of projects in Phases I through III including: 2' Shoulder Pave+RS+Safety Wedge Rumble Strip Rumble StripE 6-inch Edge Lines Ground In Wet-Reflective Markings Road Departure Crashes Highest voting results was for Installing Shoulder Treatments (Rumble Strips, Pavement Marking, Pave Shoulders, etc) 6/25/2012
Segment Project Summary 6/25/2012
What’s Next • Counties • Continue assembling information about previous deployment of safety strategies; shoulder rumblestrips, 6” edgelines, street lights, chevrons, etc. • Review, Edit/Concur with Emphasis Areas, Target Crash Types and Safety Strategies • Secure Location for Workshops • Secure Caterer • Finalize Invitation and Invite List • Decide/Secure Local Safety Advocate – Presenter • Workshops • Group 2A – July 16th - Roseau, Kittson, Marshall, Pennington • Group 2B – July 26th – Norman, Polk, Red Lake • Group 2C – July 31st – Beltrami, Clearwater, Hubbard, Lake of the Woods 6/25/2012
More Information • Mn/DOT State Aid website • www.dot.state.mn.us/stateaid • Otter Tail County Safety Plan • http://www.dot.state.mn.us/stateaid/sa_county_traffic_safety_plans.html • Contact Information • Howard Preston, CH2M HILL, 651.365.8514, howard.preston@ch2m.com • Nikki Farrington, CH2M HILL, 651.365.8536, nicole.farrington@ch2m.com • Mike Marti, SRF Consulting Group, 763.249.6779, mmarti@srfconsulting.com • Carla Stueve, SRF Consulting Group, 765.249.6797, cstueve@srfconsulting.com • Renae Kuehl, SRF Consulting Group, 765.249.6783, rkeuhl@srfconsulting.com • Ann Johnson, P.E. Services, 612.275.8190, johns421@umn.edu Questions? 6/25/2012