Download
1 / 5
50 likes | 205 Views
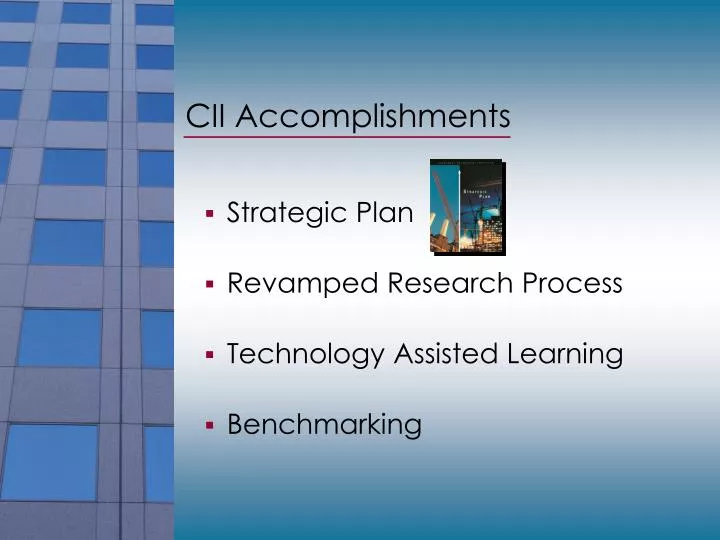
CII Accomplishments. Strategic Plan Revamped Research Process Technology Assisted Learning Benchmarking. Safety Performance - TRIR. 16.00. 14.30. 14.20. Industry*. 14.00. 13.00. 13.10. CII**. 12.20. 12.00. 11.80. 10.60. 9.90. 10.00. 9.50. 8.80. 8.60. 8.30. 7.90. 8.00.

E N D
CII Accomplishments • Strategic Plan • Revamped Research Process • Technology Assisted Learning • Benchmarking
Safety Performance - TRIR 16.00 14.30 14.20 Industry* 14.00 13.00 13.10 CII** 12.20 12.00 11.80 10.60 9.90 10.00 9.50 8.80 8.60 8.30 7.90 8.00 Total Recordable Incidence Rate 7.10 7.19 6.80 6.12 6.00 5.32 4.31 4.00 3.44 3.00 2.66 2.30 1.67 1.60 1.59 2.00 1.23 1.03 1.02 1.16 0.88 0.00 1989 1990 1991 1992 1993 1994 1995 1996 1997 1998 1999 2000 2001 2002 2003 2004 325 413 477 497 527 613 644 770 518 765 995 936 1,117 1,073 1,140 1,195 Year and Work Hours (MM) * OSHA Construction Division, SIC 15-17 Reflects OSHA Reporting Change
Safety Performance - DART 8.00 6.80 7.00 Industry* 6.79 6.10 CII** 5.80 6.00 5.50 5.50 4.90 5.00 4.50 4.40 4.20 4.10 4.00 4.00 DART (LWCIR) Incidence Rate 3.80 4.00 3.60 3.00 1.90 2.00 1.55 1.45 1.14 0.81 0.63 1.00 0.41 0.46 0.45 0.55 0.31 0.36 0.27 0.33 0.26 0.23 0.00 1989 1990 1991 1992 1993 1994 1995 1996 1997 1998 1999 2000 2001 2002 2003 2004 325 413 477 497 527 613 644 888 591 763 1,122 936 1,117 1,073 1,104 1,301 Year and Work Hours (MM) * OSHA Construction Division, SIC 15-17 Reflects OSHA Reporting Change
What’s Next • Executive Leadership Course • New Research for 2005 • PIP and FIATECH
Proposed Research Topics • Application of Lean at Project Level • Construction Industry Craft Training • Examination of Shipbuilding Industry • Building on CII Safety Research • Lawyerization of the Industry • Modularization Review • Lessons Learned II • Design Effectiveness II