Download

1 / 70
700 likes | 901 Views
Experiences with homogenization of daily and monthly series of air temperature, precipitation and relative humidity in the Czech Republic, 1961-2007. P. Štěpánek 1 , P. Zahradn íček 1. 1 Czech Hydrometeorological Institute, Regional Office Brno, Czech Republic. E-mail: petr.stepanek@chmi.cz.

E N D
Experiences with homogenization of daily and monthly series of air temperature, precipitation and relative humidity in the Czech Republic, 1961-2007 P. Štěpánek1, P. Zahradníček1 1 Czech Hydrometeorological Institute, Regional Office Brno, Czech Republic E-mail: petr.stepanek@chmi.cz COST-ESO601 meeting and Sixth Seminar for Homogenization and Quality Control in Climatological Databases
Processing before any data analysis Software AnClim, ProClimDB
Homogenization • Change of measuring conditions inhomogeneities
Reliability of DetectingInhomogeneities by statistical tests (case study) Detection A • generated series of random numbers (properties of air temperature series for year, summer and winter, CZ) • introduced steps with various amount of change in level • various position of the steps • various lengths of the series • 950 series, p=0.05
DetectingInhomogeneities by SNHT (p=0.05, 950 series) Detection A
we depend upon statistical tests results Assessing Homogeneity - Problems • most of metadata incomplete
we depend upon statistical tests results Assessing Homogeneity - Problems • most of metadata incomplete • uncertainty in test results - right inhomogeneity detection is problematic (for smaller amount of change)
„Ensemble“ approach - processing of big amount of test resultsfor each individual series Proposed solution SOLUTION • most of metadata incomplete • uncertainty in test results - the right inhomogeneity detection is problematic • To get as many test results for each candidate series as possible • For each year, group of years and whole series: portion of number of detected inhomogenities in number of all possible (theoretical) detections
Adventages of the „Ensemble“ approach • we know relevance (probability) of each inhomogeneity • we can easily assess quality of measurements for series as a whole
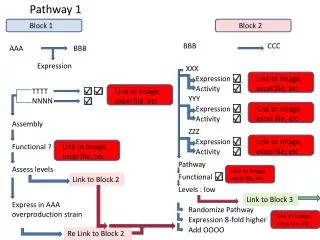
How to increase number of test results Diagram Days, Months, seasons, year
Creating Reference Series • for monthly, daily data (each month individually) • weighted/unweighted mean from neighbouring stations • criterions used for stations selection (or combination of it): • best correlated / nearest neighbours (correlations – from the first differenced series) • limit correlation, limit distance • limit difference in altitudes • neighbouring stations series should be standardized to test series AVG and / or STD (temperature - elevation, precipitation - variance) - missing data are not so big problem then
Relative homogeneity testing • Available tests: • Alexandersson SNHT • Bivariate test of Maronna and Yohai • Mann – Whitney – Pettit test • t-test • Easterling and Peterson test • Vincent method • … 20 year parts of the daily series(40 for monthly series with 10 years overlap), in SNHT splitting into subperiods in position of detected significant changepoint (30-40 years per one inhomogeneity)
Homogeneity assessment Homogeneity assessment Output example: Station Čáslav, 3rd segment, 1911-1950, n=40 • Quality control • Homogenization • Data Analysis
Homogeneity assessment, Output II example: Homogeneity assessment Summed numbers of detections for individual years
Homogeneity assessment Homogeneity assessment • combining several outputs (sums of detections in individual years, metadata, graphs of differences/ratios, …)
Adjusting monthly data • using reference series based on correlations • adjustment: from differences/ratios 20 years before and after a change, monhtly • smoothing monthly adjustments (low-pass filter for adjacent values)
Example: Adjusting values - evaluation Example combining series
Iterative homogeneity testing • several iteration of testing and results evaluation • several iterations of homogeneity testing and series adjusting (3 iterations should be sufficient) • question of homogeneity of reference series is thus solved: • possible inhomogeneities should be eliminated by using averages of several neighbouring stations • if this is not true: in next iteration neighbours should be already homogenized
Dependence of tested series on reference series Filling missing values • Before homogenization: influence on right inhomogeneity detection • After homogenization: more precise - data are not influenced by possible shifts in the series
Using daily data for inhomogeneities detection • Additional information to monthly, seasonal and annual values testing • Advantageous in case of breaks appears near ends of series • Missing values – no such influence like in case of monthly data • Problems (normal distribution or autocorellations) but can be handled to some extend • Correlation coefficients (tested versus reference series)are slightly lower (compared to monthly data), but still high enough (around 0.9 even in case precipitation)
Homogenization of daily values –precipitation series • working with individual monthly values (to get rid of annual cycle) • It is still needed to adapt data to approximate to normal distribution • One of the possibilities: consider values above 0.1 mm only • Additional transformation of series of ratios (e.g. with square root)
Homogenization of precipitation – daily values Original values - far from normal distribution (ratios tested/reference series) Frequencies
Homogenization of precipitation – daily values • Limit value 0.1 mm (ratios tested/reference series) Frequencies
Homogenization of precipitation – daily values • Limit value 0.1 mm, square root transformation (of ratios) (ratios tested/reference series) Frequencies
Problem of independence, Precipitation above 1 mm • August, Autocorrelations
Problem of independece,Temperature • August, Autocorrelations
Problem of independece,Temperature differences • August, Autocorrelations
WP1 SURVEY (Enric Aguilar)Daily data -Correction (WP4) • Very few approaches actually calculate special corrections for daily data. • Most approaches either • Do nothing (discard data) • Apply monthly factors • Interpolate monthly factors • The survey points out several other alternatives that WG5 needs to investigate
WG1 PROPOSAL TO WG4.Methods • Interpolation of monthly factors • MASH • Vincent et al (2002) • Nearest neighbour resampling models, by Brandsma and Können (2006) • Higher Order Moments (HOM), by Della Marta and Wanner (2006) • Two phase non-linear regression (Mestre)
Adjusting daily valuesfor inhomogeneities, from monthlyversus dailyadjustments(„delta“ method)
Adjustingfrom monthly data • monthly adjustments smoothed with Gaussian low pass filter (weights approximately 1:2:1) • smoothed monthly adjustments are then evenly distributed among individual days
Adjusting straight from daily data • Adjustment estimated for each individual day (series of 1st Jan, 2nd Jan etc.) • Daily adjustments smoothed with Gaussian low pass filter for 90 days (annual cycle 3 times to solve margin values)
Adjustments(Delta method) • The same final adjustments may be obtained from either monthly averages or through direct use of daily data (for the daily-values-based approach, it seems reasonable to smooth with a low-pass filter for 60 days. The same results may be derived using a low-pass filter for two months (weights approximately 1:2:1) and subsequently distributing the smoothed monthly adjustments into daily values) (1 – raw adjustments, 2 – smoothed adjustments, 3 – smoothed adjustments distributed into individual days), b) daily-based approach (4 – individual calendar day adjustments, 5 – daily adjustments smoothed by low-pass filter for 30 days, 6 – for 60 days, 7 – for 90 days)
Variable correction • f(C(d)|R), function build with the reference dataset R, d – daily data • cdf, and thus the pdf of the adjusted candidate series C*(d) is exactly the same as the cdf or pdf of the original candidate series C(d)
Variable correction 1996
Variable correction, q-q function Michel Déqué, Global and Planetary Change 57 (2007) 16–26
Variable correction, The higher-order moments method DELLA-MARTA AND WANNER, JOURNAL OF CLIMATE 19 (2006)4179-4197
RemarksHomogenization without metadata – recommendations how to increase its confidence • Daily, monthly, seasonal, annual data • Various reference series • Variousstatistical tests • 40 year periods(20 for daily data), some overlap • Several steps - iterations
Homogenization of the series in the Czech Republic
Spatial distribution of climatological stations Spatial distribution • period 1961-2007 • 200 stations • mean minimum distance: 12 km
Correlation coefficients, change in space, monthly air temperature Average of monthly correlation coefficients, 1961-2000, individual observation hours
Spatial distribution of precipitation stations Spatial distribution • period 1961-2007 • 600 stations • mean minimum distance: 7.5 km
Correlation coefficients, change in space, monthly precipitation 2483 values, average of monthly correlation coefficients
Correlations between tested and reference series Air temperature Graphs - selection Boxplots: - Median - Upper and lower quartiles (for 200 testes series)
Correlations between tested and reference series Relative Humidity Graphs - selection Boxplots: - Median - Upper and lower quartiles (for 200 testes series)
Correlations between tested and reference series Precipitation, snow depth, new snow Graphs - selection Boxplots: - Median - Upper and lower quartiles (for 800 testes series)
Correlations between tested and reference series Sunshine duration Graphs - selection Boxplots: - Median - Upper and lower quartiles (for 100 testes series)
Correlations between tested and reference series Wind speed Graphs - selection Boxplots: - Median - Upper and lower quartiles (for 200 testes series)
Correlations between tested and reference series Temperature, daily values Graphs - selection Boxplots: - Median - Upper and lower quartiles (for 200 testes series)