Download
1 / 35
350 likes | 364 Views
Join us in exploring the energy scaling in hadron-hadron collisions, from min-bias to the underlying event. Discover the latest studies at CDF and CMS with detailed data analysis and comparison of Monte-Carlo model generators. Gain insights into charged particle densities and energy dependence for a comprehensive understanding of these collisions.

E N D
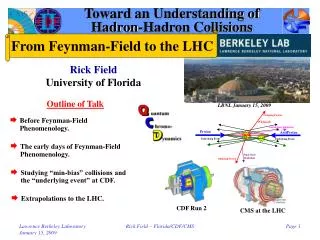
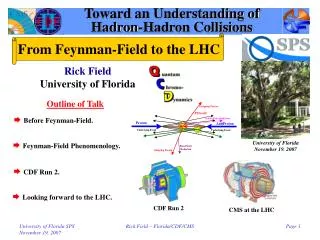
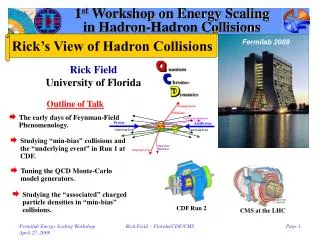
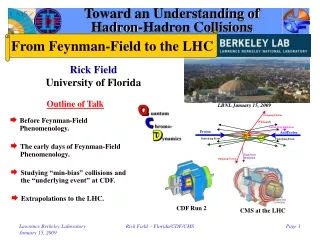
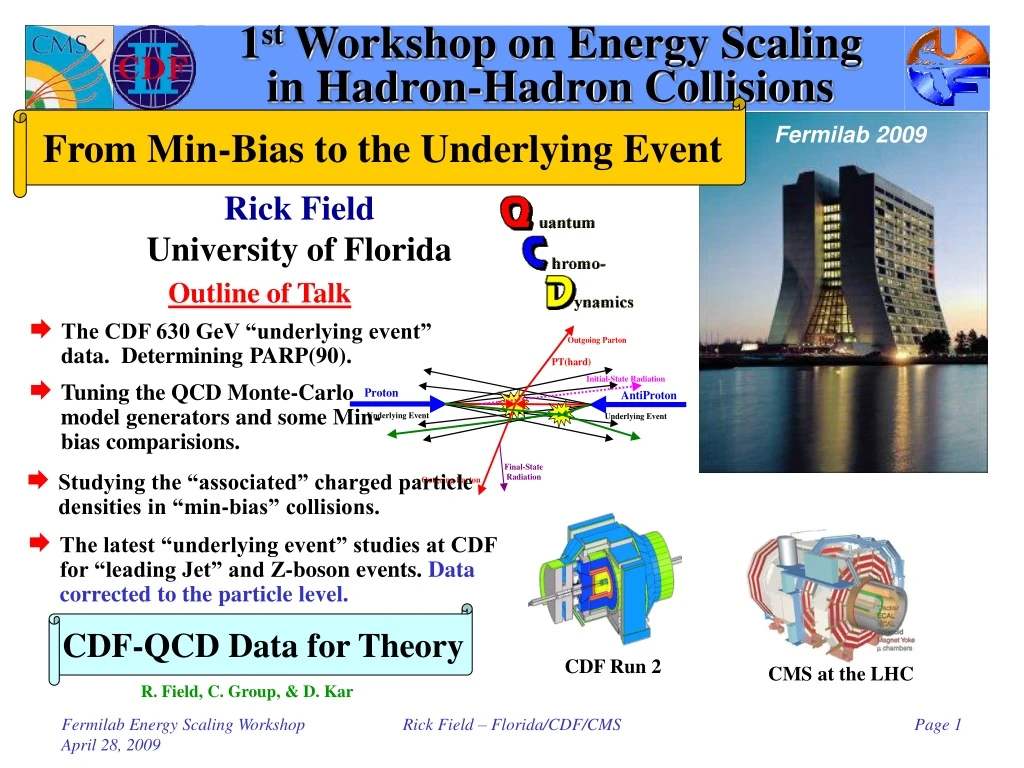
1st Workshop on Energy Scalingin Hadron-Hadron Collisions From Min-Bias to the Underlying Event Fermilab 2009 Rick Field University of Florida Outline of Talk • The CDF 630 GeV “underlying event” data. Determining PARP(90). • Tuning the QCD Monte-Carlo model generators and some Min-bias comparisions. • Studying the “associated” charged particle densities in “min-bias” collisions. • The latest “underlying event” studies at CDF for “leading Jet” and Z-boson events. Data corrected to the particle level. CDF-QCD Data for Theory CDF Run 2 CMS at the LHC R. Field, C. Group, & D. Kar Rick Field – Florida/CDF/CMS
Tuning PYTHIA:Multiple Parton Interaction Parameters Hard Core Determine by comparing with 630 GeV data! Affects the amount of initial-state radiation! Take E0 = 1.8 TeV Reference point at 1.8 TeV Rick Field – Florida/CDF/CMS
“Transverse” Conesvs “Transverse” Regions • Sum the PT of charged particles in two cones of radius 0.7 at the same h as the leading jet but with |DF| = 90o. • Plot the cone with the maximum and minimum PTsum versus the ET of the leading (calorimeter) jet. “Cone Analysis” (Tano, Kovacs, Huston, Bhatti) Transverse Cone: p(0.7)2=0.49p Transverse Region: 2p/3=0.67p Rick Field – Florida/CDF/CMS
Energy Dependenceof the “Underlying Event” “Cone Analysis” (Tano, Kovacs, Huston, Bhatti) • Sum the PT of charged particles (pT > 0.4 GeV/c) in two cones of radius 0.7 at the same h as the leading jet but with |DF| = 90o. Plot the cone with the maximum and minimum PTsum versus the ET of the leading (calorimeter) jet. • Note that PYTHIA 6.115 is tuned at 630 GeV with PT0 = 1.4 GeV and at 1,800 GeV with PT0 = 2.0 GeV. This implies that e = PARP(90) should be around 0.30 instead of the 0.16 (default). • For the MIN cone 0.25 GeV/c in radius R = 0.7 implies a PTsum density of dPTsum/dhdf = 0.16 GeV/c and 1.4 GeV/c in the MAX cone implies dPTsum/dhdf = 0.91 GeV/c (average PTsum density of 0.54 GeV/c per unit h-f). 630 GeV 1,800 GeV PYTHIA 6.115 PT0 = 1.4 GeV PYTHIA 6.115 PT0 = 2.0 GeV Rick Field – Florida/CDF/CMS
“Transverse” Charged DensitiesEnergy Dependence Increasing e produces less energy dependence for the UE resulting in less UE activity at the LHC! Lowering PT0 at 630 GeV (i.e. increasing e) increases UE activity resulting in less energy dependence. • Shows the “transverse” charged PTsum density (|h|<1, PT>0.4 GeV) versus PT(charged jet#1) at 630 GeV predicted by HERWIG 6.4 (PT(hard) > 3 GeV/c, CTEQ5L) and a tuned version of PYTHIA 6.206 (PT(hard) > 0, CTEQ5L, Set A, e = 0, e = 0.16 (default) and e = 0.25 (preferred)). • Also shown are the PTsum densities (0.16 GeV/c and 0.54 GeV/c) determined from the Tano cone analysis at 630 GeV Rick Field Fermilab MC Workshop October 4, 2002! Reference point E0 = 1.8 TeV Rick Field – Florida/CDF/CMS
PYTHIA 6.2 Tunes All use LO as with L = 192 MeV! UE Parameters Uses CTEQ6L Tune A energy dependence! ISR Parameter Intrinsic KT Rick Field – Florida/CDF/CMS
PYTHIA 6.2 Tunes These are “old” PYTHIA 6.2 tunes! There are new 6.420 tunes by Peter Skands (Tune S320, update of S0) Peter Skands (Tune N324, N0CR) Hendrik Hoeth (Tune P329, “Professor”) All use LO as with L = 192 MeV! UE Parameters Tune B Tune AW Tune BW Tune A ATLAS energy dependence! ISR Parameter Tune DW Tune D6 Tune D Tune D6T Intrinsic KT Rick Field – Florida/CDF/CMS
Charged Particle Density: dN/dh • Charged particle (all pT) pseudo-rapidity distribution, dNchg/dhdf, at 1.96 TeV for inelastic non-diffractive collisions from PYTHIA Tune A, Tune S320, and Tune P324. • Charged particle (pT>0.5 GeV/c) pseudo-rapidity distribution, dNchg/dhdf, at 1.96 TeV for inelastic non-diffractive collisions from PYTHIA Tune A, Tune S320, and Tune P324. Rick Field – Florida/CDF/CMS
CDF Run 2 Min-Bias “Associated”Charged Particle Density “Associated” densities do not include PTmax! Highest pT charged particle! • Use the maximum pT charged particle in the event, PTmax, to define a direction and look at the the “associated” density, dNchg/dhdf, in “min-bias” collisions (pT > 0.5 GeV/c, |h| < 1). It is more probable to find a particle accompanying PTmax than it is to find a particle in the central region! • Shows the data on the Df dependence of the “associated” charged particle density, dNchg/dhdf, for charged particles (pT > 0.5 GeV/c, |h| < 1, not including PTmax) relative to PTmax (rotated to 180o) for “min-bias” events. Also shown is the average charged particle density, dNchg/dhdf, for “min-bias” events. Rick Field – Florida/CDF/CMS
CDF Run 2 Min-Bias “Associated”Charged Particle Density Rapid rise in the particle density in the “transverse” region as PTmax increases! PTmax > 2.0 GeV/c Transverse Region Transverse Region Ave Min-Bias 0.25 per unit h-f PTmax > 0.5 GeV/c • Shows the data on the Df dependence of the “associated” charged particle density, dNchg/dhdf, for charged particles (pT > 0.5 GeV/c, |h| < 1, not including PTmax) relative to PTmax (rotated to 180o) for “min-bias” eventswith PTmax > 0.5, 1.0, and 2.0 GeV/c. • Shows “jet structure” in “min-bias” collisions (i.e.the “birth” of the leading two jets!). Rick Field – Florida/CDF/CMS
CDF Run 2 Min-Bias “Associated”Charged Particle Density PY Tune A PTmax > 2.0 GeV/c Transverse Region Transverse Region PTmax > 0.5 GeV/c • Shows the data on the Df dependence of the “associated” charged particle density, dNchg/dhdf, for charged particles (pT > 0.5 GeV/c, |h| < 1, not including PTmax) relative to PTmax (rotated to 180o) for “min-bias” eventswith PTmax > 0.5 GeV/c and PTmax > 2.0 GeV/c compared with PYTHIA Tune A (after CDFSIM). • PYTHIA Tune A predicts a larger correlation than is seen in the “min-bias” data (i.e.Tune A “min-bias” is a bit too “jetty”). Rick Field – Florida/CDF/CMS
Min-Bias “Associated”Charged Particle Density • Shows the “associated” charged particle density in the “toward”, “away” and “transverse” regions as a function of PTmax for charged particles (pT > 0.5 GeV/c, |h| < 1, not including PTmax) for “min-bias” events at 1.96 TeVfrom PYTHIA Tune A (generator level). “Toward” Region ~ factor of 2! “Transverse” “Transverse” • Shows the Df dependence of the “associated” charged particle density, dNchg/dhdf, for charged particles (pT > 0.5 GeV/c, |h| < 1, not including PTmax) relative to PTmax (rotated to 180o) for “min-bias” events at 1.96 TeVwith PTmax > 0.5, 1.0, 2.0, 5.0, and 10.0 GeV/c from PYTHIA Tune A (generator level). Rick Field – Florida/CDF/CMS
Min-Bias “Associated”Charged Particle Density • Shows the Df dependence of the “associated” charged particle density, dNchg/dhdf, for charged particles (pT > 0.5 GeV/c, |h| < 1, not including PTmax) relative to PTmax (rotated to 180o) for “min-bias” events at 1.96 TeVwith PTmax > 0.5 GeV/c for PYTHIATune A, Tune S320, Tune P320 (generator level). • Shows the Df dependence of the “associated” charged particle density, dNchg/dhdf, for charged particles (pT > 0.5 GeV/c, |h| < 1, not including PTmax) relative to PTmax (rotated to 180o) for “min-bias” events at 1.96 TeVwith PTmax > 2.0 GeV/c for PYTHIATune A, Tune S320, Tune P320 (generator level). Rick Field – Florida/CDF/CMS
Min-Bias “Associated”Charged Particle Density • Shows the “associated” charged particle density in the “toward”, “away” and “transverse” regions as a function of PTmax for charged particles (pT > 0.5 GeV/c, |h| < 1, not including PTmax) for “min-bias” events at 1.96 TeVfrom PYTHIA Tune A and Tune S320 at the particle level (i.e. generator level). Rick Field – Florida/CDF/CMS
Min-Bias “Associated”Charged Particle Density RDF LHC Prediction! • Shows the “associated” charged particle density in the “transverse” region as a function of PTmax for charged particles (pT > 0.5 GeV/c, |h| < 1, not including PTmax) for “min-bias” events at 1.96 TeVfrom PYTHIATune A, Tune S320, Tune N324, and Tune P329 at the particle level (i.e. generator level). Tevatron LHC • Extrapolations of PYTHIA Tune A, Tune DW, Tune DWT, Tune S320, and Tune P329 to the LHC. Rick Field – Florida/CDF/CMS
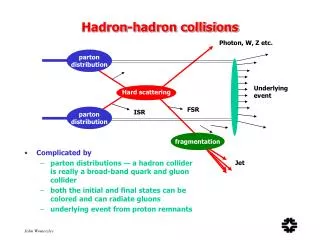
“Hard Scattering” Component QCD Monte-Carlo Models:High Transverse Momentum Jets • Start with the perturbative 2-to-2 (or sometimes 2-to-3) parton-parton scattering and add initial and final-state gluon radiation (in the leading log approximation or modified leading log approximation). “Underlying Event” • The “underlying event” consists of the “beam-beam remnants” and from particles arising from soft or semi-soft multiple parton interactions (MPI). The “underlying event” is an unavoidable background to most collider observables and having good understand of it leads to more precise collider measurements! • Of course the outgoing colored partons fragment into hadron “jet” and inevitably “underlying event” observables receive contributions from initial and final-state radiation. Rick Field – Florida/CDF/CMS
“Hard Scattering” Component QCD Monte-Carlo Models:Lepton-Pair Production • Start with the perturbative Drell-Yan muon pair production and add initial-state gluon radiation (in the leading log approximation or modified leading log approximation). “Underlying Event” • The “underlying event” consists of the “beam-beam remnants” and from particles arising from soft or semi-soft multiple parton interactions (MPI). • Of course the outgoing colored partons fragment into hadron “jet” and inevitably “underlying event” observables receive contributions from initial-state radiation. Rick Field – Florida/CDF/CMS
“Towards”, “Away”, “Transverse” Look at the charged particle density, the charged PTsum density and the ETsum density in all 3 regions! • Look at correlations in the azimuthal angle Df relative to the leading charged particle jet (|h| < 1) or the leading calorimeter jet (|h| < 2). • Define |Df| < 60o as “Toward”, 60o < |Df| < 120o as “Transverse ”, and |Df| > 120o as “Away”. Each of the three regions have area DhDf = 2×120o = 4p/3. Df Correlations relative to the leading jet Charged particles pT > 0.5 GeV/c |h| < 1 Calorimeter towers ET > 0.1 GeV |h| < 1 “Transverse” region is very sensitive to the “underlying event”! Z-Boson Direction Rick Field – Florida/CDF/CMS
Event Topologies • “Leading Jet” events correspond to the leading calorimeter jet (MidPoint R = 0.7) in the region |h| < 2 with no other conditions. “Leading Jet” subset • “Inclusive 2-Jet Back-to-Back” events are selected to have at least two jets with Jet#1 and Jet#2 nearly “back-to-back” (Df12 > 150o) with almost equal transverse energies (PT(jet#2)/PT(jet#1) > 0.8) with no other conditions . “Inc2J Back-to-Back” subset “Exc2J Back-to-Back” • “Exclusive 2-Jet Back-to-Back” events are selected to have at least two jets with Jet#1 and Jet#2 nearly “back-to-back” (Df12 > 150o) with almost equal transverse energies (PT(jet#2)/PT(jet#1) > 0.8) and PT(jet#3) < 15 GeV/c. “Charged Jet” • “Leading ChgJet” events correspond to the leading charged particle jet (R = 0.7) in the region |h| < 1 with no other conditions. • “Z-Boson” events are Drell-Yan events with 70 < M(lepton-pair) < 110 GeV with no other conditions. Z-Boson Rick Field – Florida/CDF/CMS
“transMAX” & “transMIN” • Define the MAX and MIN “transverse” regions (“transMAX” and “transMIN”) on an event-by-event basis with MAX (MIN) having the largest (smallest) density. Each of the two “transverse” regions have an area in h-f space of 4p/6. “transMIN” very sensitive to the “beam-beam remnants”! Z-Boson Direction Area = 4p/6 • The “transMIN” region is very sensitive to the “beam-beam remnant” and the soft multiple parton interaction components of the “underlying event”. • The difference, “transDIF” (“transMAX” minus “transMIN”), is very sensitive to the “hard scattering” component of the “underlying event” (i.e. hard initial and final-state radiation). • The overall “transverse” density is the average of the “transMAX” and “transMIN” densities. Rick Field – Florida/CDF/CMS
Observables at theParticle and Detector Level “Leading Jet” “Back-to-Back” Rick Field – Florida/CDF/CMS
Overall Totals (|h| < 1) ETsum = 775 GeV! • Data at 1.96 TeV on the overall number of charged particles (pT > 0.5 GeV/c, |h| < 1) and the overall scalar pT sum of charged particles (pT > 0.5 GeV/c, |h| < 1) and the overall scalar ET sum of all particles (|h| < 1) for “leading jet” events as a function of the leading jet pT. The data are corrected to the particle level (with errors that include both the statistical error and the systematic uncertainty) and are compared with PYTHIA Tune A at the particle level (i.e. generator level).. “Leading Jet” ETsum = 330 GeV PTsum = 190 GeV/c Nchg = 30 Rick Field – Florida/CDF/CMS
“Towards”, “Away”, “Transverse” • Data at 1.96 TeV on the density of charged particles, dN/dhdf, with pT > 0.5 GeV/c and |h| < 1 for “leading jet” events as a function of the leading jet pT for the “toward”, “away”, and “transverse” regions. The data are corrected to the particle level (with errors that include both the statistical error and the systematic uncertainty) and are compared with PYTHIA Tune A at the particle level (i.e. generator level). “Leading Jet” Factor of ~13 Factor of ~16 Factor of ~4.5 • Data at 1.96 TeV on the charged particle scalar pT sum density, dPT/dhdf, with pT > 0.5 GeV/c and |h| < 1 for “leading jet” events as a function of the leading jet pT for the “toward”, “away”, and “transverse” regions. The data are corrected to the particle level (with errors that include both the statistical error and the systematic uncertainty) and are compared with PYTHIA Tune A at the particle level (i.e. generator level). • Data at 1.96 TeV on the particle scalar ET sum density, dET/dhdf, for |h| < 1 for “leading jet” events as a function of the leading jet pT for the “toward”, “away”, and “transverse” regions. The data are corrected to the particle level (with errors that include both the statistical error and the systematic uncertainty) and are compared with PYTHIA Tune A at the particle level (i.e. generator level). Rick Field – Florida/CDF/CMS
Charged Particle Density HERWIG + JIMMY Tune (PTJIM = 3.6) • Data at 1.96 TeV on the density of charged particles, dN/dhdf, with pT > 0.5 GeV/c and |h| < 1 for “Z-Boson” and “Leading Jet” events as a function of the leading jet pT or PT(Z) for the “toward”, “away”, and “transverse” regions. The data are corrected to the particle level (with errors that include both the statistical error and the systematic uncertainty) and are compared with PYTHIA Tune AW and Tune A, respectively, at the particle level (i.e. generator level). Rick Field – Florida/CDF/CMS
Charged PTsum Density • Data at 1.96 TeV on the charged scalar PTsum density, dPT/dhdf, with pT > 0.5 GeV/c and |h| < 1 for “Z-Boson” and “Leading Jet” events as a function of the leading jet pT or PT(Z) for the “toward”, “away”, and “transverse” regions. The data are corrected to the particle level (with errors that include both the statistical error and the systematic uncertainty) and are compared with PYTHIA Tune AW and Tune A, respectively, at the particle level (i.e. generator level). Rick Field – Florida/CDF/CMS
The “TransMAX/MIN” Regions • Data at 1.96 TeV on the charged particle density, dN/dhdf, with pT > 0.5 GeV/c and |h| < 1 for “Z-Boson” and “Leading Jet” events as a function of PT(Z) or the leading jet pT for the “transMAX”, and “transMIN” regions. The data are corrected to the particle level (with errors that include both the statistical error and the systematic uncertainty) and are compared with PYTHIA Tune AW and Tune A, respectively, at the particle level (i.e. generator level). • Data at 1.96 TeV on the density of charged particles, dN/dhdf, with pT > 0.5 GeV/c and |h| < 1 for “leading jet” events as a function of the leading jet pT and for Z-Boson events as a function of PT(Z) for “TransDIF” =“transMAX” minus “transMIN” regions. The data are corrected to the particle level (with errors that include both the statistical error and the systematic uncertainty) and are compared with PYTHIA Tune A and HERWIG (without MPI) at the particle level (i.e. generator level). Rick Field – Florida/CDF/CMS
The “TransMAX/MIN” Regions • Data at 1.96 TeV on the charged scalar PTsum density, dPT/dhdf, with pT > 0.5 GeV/c and |h| < 1 for “Z-Boson” and “Leading Jet” events as a function of PT(Z) or the leading jet pT for the “transMAX”, and “transMIN” regions. The data are corrected to the particle level (with errors that include both the statistical error and the systematic uncertainty) and are compared with PYTHIA Tune AW and Tune A, respectively, at the particle level (i.e. generator level). • Data at 1.96 TeV on the charged scalar PTsum density, dPT/dhdf, with pT > 0.5 GeV/c and |h| < 1 for “leading jet” events as a function of the leading jet pT and for Z-Boson events as a function of PT(Z) for “TransDIF” =“transMAX” minus “transMIN” regions. The data are corrected to the particle level (with errors that include both the statistical error and the systematic uncertainty) and are compared with PYTHIA Tune A and HERWIG (without MPI) at the particle level (i.e. generator level). Rick Field – Florida/CDF/CMS
Charged Particle <pT> • Data at 1.96 TeV on the charged particle average pT, with pT > 0.5 GeV/c and |h| < 1 for the “toward” region for “Z-Boson” and the “transverse” region for “Leading Jet” events as a function of the leading jet pT or PT(Z). The data are corrected to the particle level (with errors that include both the statistical error and the systematic uncertainty) and are compared with PYTHIA Tune AW and Tune A, respectively, at the particle level (i.e. generator level). The Z-Boson data are also compared with PYTHIA Tune DW, the ATLAS tune, and HERWIG (without MPI) Rick Field – Florida/CDF/CMS
Z-Boson: “Towards”, Transverse”, & “TransMIN” Charge Density • Data at 1.96 TeV on the density of charged particles, dN/dhdf, with pT > 0.5 GeV/c and |h| < 1 for “Z-Boson” events as a function of PT(Z) for the “toward” and “transverse” regions. The data are corrected to the particle level (with errors that include both the statistical error and the systematic uncertainty) and are compared with PYTHIA Tune AW and HERWIG (without MPI) at the particle level (i.e. generator level). Rick Field – Florida/CDF/CMS
Z-Boson: “Towards”, Transverse”, & “TransMIN” Charge Density • Data at 1.96 TeV on the charged scalar PTsum density, dPT/dhdf, with pT > 0.5 GeV/c and |h| < 1 for “Z-Boson” events as a function of PT(Z) for the “toward” and “transverse” regions. The data are corrected to the particle level (with errors that include both the statistical error and the systematic uncertainty) and are compared with PYTHIA Tune AW and HERWIG (without MPI) at the particle level (i.e. generator level). Rick Field – Florida/CDF/CMS
DWT Z-Boson: “Towards” Region • Data at 1.96 TeV on the density of charged particles, dN/dhdf, with pT > 0.5 GeV/c and |h| < 1 for “Z-Boson” events as a function of PT(Z) for the “toward” region. The data are corrected to the particle level (with errors that include both the statistical error and the systematic uncertainty) and are compared with PYTHIA Tune AW and HERWIG (without MPI) at the particle level (i.e. generator level). HW without MPI Rick Field – Florida/CDF/CMS
DWT Z-Boson: “Towards” Region • Data at 1.96 TeV on the average pT of charged particles with pT > 0.5 GeV/c and |h| < 1 for “Z-Boson” events as a function of PT(Z) for the “toward” region. The data are corrected to the particle level (with errors that include both the statistical error and the systematic uncertainty) and are compared with PYTHIA Tune AW and HERWIG (without MPI) at the particle level (i.e. generator level). HW (without MPI) almost no change! Rick Field – Florida/CDF/CMS
Z-Boson: “Towards” Region • Data at 1.96 TeV on the density of charged particles, dN/dhdf, with pT > 0.5 GeV/c and |h| < 1 for “Z-Boson” events as a function of PT(Z) for the “toward” region from PYTHIA Tune AW, Tune DW, Tune S320, and Tune P329 at the particle level (i.e. generator level). RDF LHC Prediction! Tevatron LHC • Extrapolations of PYTHIA Tune AW, Tune DW, Tune DWT, Tune S320, and Tune P329 to the LHC. Rick Field – Florida/CDF/CMS
Z-Boson: “Towards” Region RDF LHC Prediction! • Data at 1.96 TeV on the charged PTsum density, dPT/dhdf, with pT > 0.5 GeV/c and |h| < 1 for “Z-Boson” events as a function of PT(Z) for the “toward” region from PYTHIA Tune AW, Tune DW, Tune S320, and Tune P329 at the particle level (i.e. generator level). Tevatron LHC • Extrapolations of PYTHIA Tune AW, Tune DW, Tune DWT, Tune S320, and Tune P329 to the LHC. Rick Field – Florida/CDF/CMS
1st Workshop on Energy Scalingin Hadron-Hadron Collisions • Rick Field Talk 3 Wednesday at 9:00am From CDF to CMS Peter’s favorite observable: <pT> versus Nchg Summary & Conclusions & Predictions! Rick Field – Florida/CDF/CMS