Download
1 / 36
360 likes | 372 Views
Explore seismic research opportunities using IRIS and other seismic data resources. Learn how to estimate seismic hazard, analyze earthquake data, and discover predictive mathematical models. Understand earthquakes through regional tectonics and learn how to interpret seismicity rate for long-term hazard assessment.

E N D
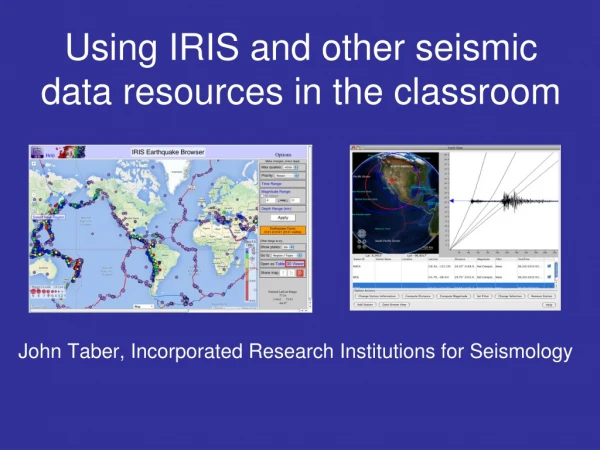
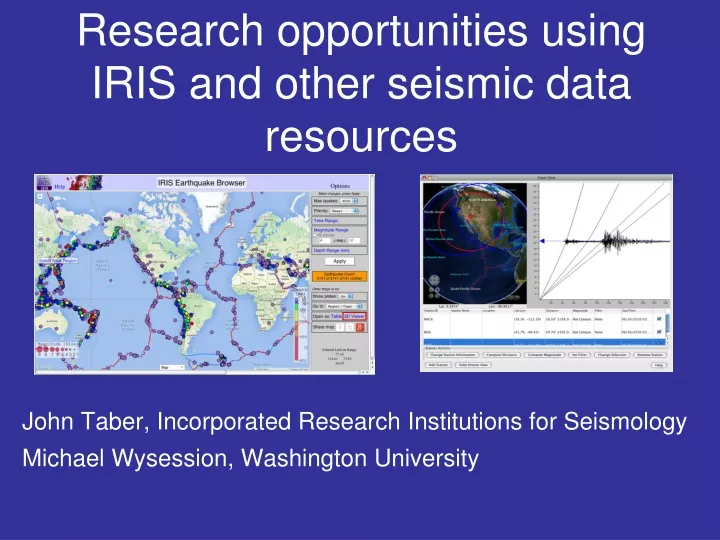
Research opportunities using IRIS and other seismic data resources John Taber, Incorporated Research Institutions for Seismology Michael Wysession, Washington University
Overview • Hands on • Estimating seismic hazard using IRIS Earthquake Browser • Discovering a predictive mathematical model • Demo • Exploring regional tectonics using focal mechanisms • Recording and analyzing data from an educational or research-grade seismometer • Viewing a set of seismograms from an earthquake • USArray ground motion visualizations • Understanding earthquakes via a simple physical model
Estimating seismic hazard Research problem You and your partner have been asked to compare the seismic hazard in two regions to determine which is safer for building a new manufacturing plant. 1.What type of data would you need to collect to make the comparison? 2. How could you express your findings in a quantitative way?
Earthquake hazard from a single fault • Would like to know • How often do the biggest earthquakes occur? • When will the next big one occur? • Extend earthquake history with geologic record
Earthquake recurrence along a single fault With a partner: Determine when the next Pallett Creek earthquake is going to occur. Can you estimate the uncertainty in your answer? Sieh et al., 1989
Earthquake recurrence along a single fault can be highly variable: probabilities hard to assess M >7: mean = 132 yr Standard deviation = 105 yr Estimated probability of next earthquake in 30 yrs is 7-51% -> Nearly Random! Sieh et al., 1989
How can we deal with unpredictable • nature of individual faults? • Try regional approach • Use the rate of earthquake occurrence • in one time period to forecast earthquake • activity in another time period • Combine results from multiple faults • Consider more than just the biggest • earthquakes
IRIS Earthquake Browser - www.iris.edu/ieb • Can use for introduction to plate tectonics • Explore plate boundaries • Turn plate boundary lines on and off • Interactive 3D viewer • General exploration of spatial distribution of local and regional seismicity
Estimating seismic hazard Steps: • Select a region of the world that is of interest to you • Interrogate the earthquake catalog to determine the number of events that occur in a 25 year period • Set the Time Range • Set the Magnitude Range • In an Excel spreadsheet, record the total number of events for each magnitude range • Determine the number of earthquakes/year for each magnitude range • Plot the magnitude range vs the number of earthquakes/year
Questions to discuss with a partner • Given the range of the data, what sort of plot gives the clearest representation of the data? • Do you see any patterns or trends in your data? • How does your plot compare to your partner’s plot of a different region? • What is the likelihood of earthquakes of magnitude 6.0 or greater and 7.0 or greater occurring in the next year in the 2 regions? • What is the likelihood of these events occurring in the next 100 years in each region?
California (blue) and Eastern US Earthquakes (red) Earthquakes/year Magnitude
Interpretation questions • How can you use the seismicity information to estimate which of your two regions would be a safer choice for the manufacturing plant mentioned at the beginning of the exercise? • What are some assumptions, limitations, and potential sources of error in drawing conclusions about long-term seismic hazard using the above technique?
Going from seismicity rate to ground shaking California 6.5 Virginia M 5.8 Ground shaking from a magnitude 5 earthquake in the east is approximately equivalent to that of a magnitude 6 earthquake in the west. http://pasadena.wr.usgs.gov/office/hough/east-vs-west.jpg
USGS National Seismic Hazard Map Submitted draft exercise explores hazard map
Exploring regional tectonics using focal mechanisms • Visual sorting of normal, reverse, and strike-slip mechanisms • Can explore distribution in a subduction zone • IRIS main menu: Data and Software > Products • Select Moment Tensors, then Quick links • http://www.iris.edu/spud/momenttensor • Focal mechanism animation available
Recording and analyzing seismic data using jAmaseis • Real time data streaming and simple analysis • Simple filtering, arrival picking, locations, magnitudes
Recording and analyzing seismic data using jAmaseis • Real time data streaming and simple analysis • Simple filtering, arrival picking, locations, magnitudes • Up to 3 data streams can be viewed and stored locally • Local or remote educational seismographs • Any global research station received and stored in the IRIS Data Management Center
Recordings from the Global Seismic Network • Real time data streaming and simple analysis
Potential seismograph-related research topics • Local seismograph calibration and sensitivity • Distance/magnitude relationship • Alan Kafka • Analyzing seismic data to find what earthquakes were recorded and then learning about the tectonics of each region • Dave Voorhees’ student • Finding the best recording location
Rapid Earthquake Viewer • Developed and maintained by Univ S. Carolina
Understanding earthquakes via a simple physical model • Earthquake machine • Simple data collection and analysis leads to very similar result to real earthquake catalog
USArray Ground Motion Visualizations • Visualizations exist for all parts of lower 48 • 1D and 3D versions
EPO web page fromwww.iris.edu • Feedback? • Comments? • Questions?
USArray Ground Motion Visualizations • Visualizations exist for all parts of lower 48
Investigating Earth structure using tomographic models • Select a region and a submitted velocity model and generate a cross section • Fate of slabs • Crustal and upper mantle thickness under mountain ranges