Download
1 / 21
210 likes | 337 Views
Observed Trends in South American Precipitation. Brant Liebmann Vicente Barros Carolina S. Vera Juli á n B á ez Leila M.V. Carvalho Anji Seth In é s Camilloni Marty P. Hoerling Dave Allured Mario Bidegain Jos é A. Marengo.

E N D
Observed Trends inSouth American Precipitation Brant Liebmann Vicente Barros Carolina S. Vera Julián Báez Leila M.V. Carvalho Anji Seth Inés Camilloni Marty P. Hoerling Dave Allured Mario Bidegain José A. Marengo
If a flood is defined as monthly flow at Corrientes more than 2 standard deviations above its mean, there were almost 6times as many floods in the 20 years from 1980-1999 as there were in the 60 years from 1920-1979.
Previous work: Barros, Castaneda, Doyle (2000): Increase in precipitation over most of Argentina from 1956-1991. Castaneda and Barros (1994): Humid Pampa (Argentina) increase in rain, mainly after 1960. Robertson and Mechoso (1998): Decadal variability and non-linear upward trend in southeast South America rivers. Marengo (2004): Northern Amazon Basin decrease related to El Nino?
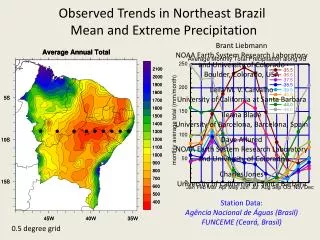
Data We wish to thank the following agencies for providing the data used in this study: Agência Nacional de Águas (Brasil) Agência Nacional Energia Elétrica (Brasil) U.T.E. Uruguay C.T.M. Salto Grande Servicio Meteorologico Nacional (Argentina, Paraguay, Uruguay) FUNCEME (Ceará, Brasil) IAPAR - SIMEPAR (Paraná, Brasil) DAEE (São Paulo, Brasil) Minesterio del Ambiente y los Recursos Naturales (Venezuela) Meteorogische Dienst Suriname METEO-France ASANA (Bolivia)
Observed Precipitation Trend mm/season
Observations versus AMIP runs January – March 1976-1999 mm/season
Southern Brazil 1976-1999 January – March standardized percent trend Stations with at least 22 yrs data
Southern Brazil Average onset date = 25 October Average end date = 9 April Trend in rainy day rain rate = 0.078 mm/day/season 76-81 94-99 Rainy day average = 14.817.5 Percent dry days = 57.246.0 (There is no apparent trend in synoptic activity)
Simultaneous Correlation (SST versus Southern Brazil Rain) JFM SST trend (1976 – 1999)
January – March rainfall – Southern Brazil Slope: 1976 - 1999 = 7.20 1948 - 1975 = 1.11 1948 - 1999 = 1.53
Slope (m3/s/yr): 1976-1999 = 49.2 1948-1975 = 20.2 1948-1999 = 17.2 Precipitation has increased by 35% (along trend line) River flow has increased by 161% (amplification noted by Berbery and Barros (2002))
Jan-March rainfall SST in southwest Atlantic Jan-Mar SST (C) Season rainfall (mm/yr) Slope: 1976 - 1999 = 0.045 deg/yr 1948 - 1975 = 0.022 1948 - 1999 = 0.022 Slope: 1976 - 1999 = 7.20 mm/yr 1948 - 1975 = 1.11 1948 - 1999 = 1.53
Running 24-year correlations Southern Brazil versus southwest Atlantic Trend removed from each segment Stations with 50 years of data 95% ‘significant’ Using 2-sided t-test
Running 24-year trends Stations with at least 50 years data (1 degree grid)
all stations Stations with 50 year records R = 0.91 (detrended) R = 0.92 R = 0.998
An observed positive precipitation trend during the rainy season in Southern Brazil is most prominent from 1976-1999, but is evident earlier. The trend is characterized by an increase in the number of rainy days per season and an increase in the amount per rainy day. The precipitation trend is related to one in SST, although perhaps not causally. The SST trend seems to result from a decrease in the strength of the South Atlantic high. The negative trend near SACZ is not ‘significant’, but seems to be indicative of decadal scale variability (near the coast). Data in Amazon are of insufficient length to draw conclusions.
Gridded fields of daily precipitation are available by visiting: http://www.cdc.noaa.gov/people/ brant.liebmann/data/s_america_rain.html