Download
1 / 38
390 likes | 531 Views
Explore the characteristics, occurrence, and profit maximization strategies in pure competition markets with detailed examples, total revenue approaches, and firm decision-making processes. Learn about the P=MC rule and short-run supply curve.

E N D
PURECOMPETITION Chapter 9 Lecture 11 AND 12
Chapter Objectives • The four basic market models • Conditions for pure competition • Profit maximization for competitive firms • The competitive firm supply curve • Industry entry and exit • Industry cost structure • Economic efficiency 9-2
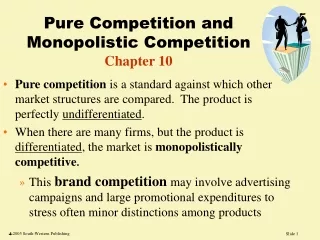
Four Market Models Industries with defining characteristics are grouped into four market models: • Pure competition • Pure monopoly • Monopolistic competition • Oligopoly Imperfect Competition Pure Competition Monopolistic Competition Pure Monopoly Oligopoly Market Structure Continuum 9-3
Pure Competition: Characteristics and Occurrence • A very large number of independently acting producers. • Firms produce a standardized product • Individual firms are “Price takers” in that no firm has control over the market price. • Free entry and exit • Perfectly elastic demand • Average revenue • Marginal revenue • Price 9-4
$1179 Firm’s Demand Schedule (Average Revenue) Firm’s Revenue Data 1048 917 786 ] ] ] ] ] ] ] ] ] ] 655 Price and Revenue 524 393 262 131 2 4 6 8 10 12 Quantity Demanded (Sold) Demand as seen by a Purely Competitive seller TR P QD TR MR $131 131 131 131 131 131 131 131 131 131 131 0 1 2 3 4 5 6 7 8 9 10 $0 131 262 393 524 655 786 917 1048 1179 1310 $131 131 131 131 131 131 131 131 131 131 D = MR = AR 9-5
Short Run: Profit Maximization • Since purely competitive firms are price takers, they can maximize profit only by adjusting output. • There are two ways to determine the level of output at which a competitive firm will realize maximum profit or minimum loss. • total-revenue—total cost approach • marginal revenue—marginal cost approach 9-7
Total Revenue and Total Cost approach to Profit Maximization • Confronted with market price of its product, the competitive producer asks three questions: • Should the product be produced? • If so, in what amount? • What economic profit (loss) will be realized? 9-8
Total Revenue Total Cost Approach Price = $131 (1) Total Product (Output) (Q) (2) Total Fixed Cost (TFC) (3) Total Variable Cost (TVC) (4) Total Cost (TC) (5) Total Revenue (TR) (6) Profit (+) or Loss (-) $100 100 100 100 100 100 100 100 100 100 100 0 1 2 3 4 5 6 7 8 9 10 $0 90 170 240 300 370 450 540 650 780 930 $100 190 270 340 400 470 550 640 750 880 1030 $0 131 262 393 524 655 786 917 1048 1179 1310 $-100 -59 -8 +53 +124 +185 +236 +277 +298 +299 +280 Do You See Profit Maximization? Perfectly competitive firms will produce when the market Price exceeds per unit cost of production Now Let’s Graph The Results… 9-9
Marginal Revenue Marginal Cost Approach to Profit Maximization • The firm compares the amount each additional unit of output would add to total revenue (marginal revenue) and the additional cost each unit of output adds (marginal cost). • The output determining rule: the firm will maximize profit or minimize loss by producing the output at which MR = MC.
Features of the MR = MC rule • The firm should produce the last complete unit of output for which MR exceeds MC. • The MC = MR rule only applies when producing is preferable to shutting down • The rule applies to all market structure types. • For purely competitive firms, the rule can be restated as P = MC.
Profit Maximizing Case (2) Average Fixed Cost (AFC) (3) Average Variable Cost (AVC) (4) Average Total Cost (ATC) (1) Total Product (Output) (5) Marginal Cost (MC) (6) Marginal Revenue (MR) (7) Profit (+) or Loss (-) $100.00 50.00 33.33 25.00 20.00 16.67 14.29 12.50 11.11 10.00 0 1 2 3 4 5 6 7 8 9 10 $90.00 85.00 80.00 75.00 74.00 75.00 77.14 81.25 86.67 93.00 $90 80 70 60 70 80 90 110 130 150 $190.00 135.00 113.33 100.00 94.00 91.67 91.43 93.75 97.78 103.00 $131 131 131 131 131 131 131 131 131 131 $-100 -59 -8 +53 +124 +185 +236 +277 +298 +299 +280 No Surprise - Now Let’s Graph It… Do You See Profit Maximization Now? 9-13
Short run Profit Maximization Case for a Purely Competitive Firm 9-14
Short Run Profit Maximization • Produce where MR (=P) = MC • Suffer loss, still produce? • Yes if loss is less than fixed cost • Cover variable cost • Shut down if loss greater than fixed cost • Produce if P > min AVC 9-15
Short-Run Supply Curve Continuing the Same Example… Supply Schedule of a Competitive Firm Quantity Supplied Maximum Profit (+) or Minimum Loss (-) Price $151 131 111 91 81 71 61 10 9 8 7 6 0 0 $+480 +299 +138 -3 -64 -100 -100 The schedule shows the quantity a firm will produce at a variety of prices 9-19
The P=MC Rule and the Competitive Firms Short run Supply Curve 9-20
Diminishing Returns, Production Costs, and Product supply • Because of the law of diminishing returns, marginal costs eventually rise as more units of output are produced. • As output rises, marginal costs increase. • A purely competitive firm must get successively higher prices to motivate it to produce additional units of output. 9-21
Short Run Competitive Equilibrium For The Firm And The Industry Competitive firm must take the price that is Established by industry supply and demand 9-23
Long Run Profit Maximization • Assumptions • Entry and exit only • Identical costs • Constant-cost industry • Goal of the analysis: after all long run adjustments are completed, product price will be exactly equal to, and production will occur at , each firms min average total cost. • In the long run, P = min ATC • Entry eliminates profits • Exit eliminates losses 9-25
Long run Equilibrium • Economic profit is zero for individual firms and the industry in the long run equilibrium. • There is no tendency for firms to enter or leave the industry, and all existing firms are earning normal profits. • Existing firms are earning normal profits.
p P Single Firm Industry 0 0 p 80,000 90,000 100,000 100 P New Firm Entry Eliminates Profits S1 MC ATC $60 50 40 $60 50 40 S2 MR D2 D1 An increase in demand temporarily raises price Higher prices draw in new competitors Increased supply returns price to equilibrium 9-27
p P Single Firm Industry 0 0 p 80,000 90,000 100,000 100 P Exit Eliminates Losses S3 MC ATC $60 50 40 $60 50 40 S1 MR D1 D3 A decrease in demand temporarily lowers price Lower prices drive away some competitors Decreased supply returns price to equilibrium 9-28
Long Run Supply • Constant cost industry • Entry/exit does not affect LR ATC • Constant resource price • Special case • Increasing cost industry • Most industries • LR ATC increases with expansion • Specialized resources • Decreasing cost industry 9-29
P P1 P2 P3 0 Q Long-Run Supply Curve • Constant-Cost Industry S $50 Z3 Z1 Z2 D3 D1 D2 Q2 Q1 Q3 90,000 100,000 110,000 9-30
P 0 Q Long-Run Supply Curve • Increasing-Cost Industry S P2 $55 Y2 P1 $50 Y1 P3 $40 Y3 D2 D1 D3 Q2 Q1 Q3 90,000 100,000 110,000 9-31
How would a decreasing-cost industry look? • In decreasing-cost industries, firms experience lower costs as the industry expands and higher costs as the industry contracts. • As a result, the long-run supply curve of a decreasing-cost industry is downward-sloping. • The personal computer industry represents one such example. As the demand for personal computers increased, new manufacturers of computers and computer components expanded output and realized substantial economies of scale which led to lower per unit prices for finished products.
Pure Competition and Efficiency • Productive efficiency P = minimum ATC • Allocative efficiency P = MC • Maximum consumer and producer surplus • Dynamic adjustments • “Invisible Hand” revisited 9-33
Single Firm Market Price Price 0 0 Quantity Quantity Long-Run Equilibrium MC P=MC=Minimum ATC (Normal Profit) S ATC MR P P D Qf Qe Productive Efficiency: Price = minimum ATC Allocative Efficiency: Price = MC Pure competition has both in its long-run equilibrium 9-34
The Case of Generic Drugs • Efficiency gains from entry • Lower price and greater output • Purpose of drug patent • Encourage R&D • Cost recovery • Expiration of patent on drugs • Generics enter • Profits decrease, output increase • Combined CS and PS increase 9-35
Price Quantity The Case of Generic Drugs New Producers Enter Market • As price decreases to f, Consumer surplus abc increases to adf. • Producer and consumer surplus is maximized as shown by the gray triangle. a S Initial Patent Price b c P1 d f P2 D Q1 Q2 Result: Greater Quantity at Lower Prices as Predicted by the Competitive Model 9-36
Key Terms • pure competition • pure monopoly • monopolistic competition • oligopoly • imperfect competition • price taker • average revenue • total revenue • marginal revenue • break-even point • MR=MC rule • short-run supply curve • long-run supply curve • constant-cost industry • increasing-cost industry • decreasing-cost industry • productive efficiency • allocative efficiency • consumer surplus • producer surplus 9-37
Next Chapter Preview… Pure Monopoly 9-38