Download
1 / 6
60 likes | 282 Views
Prevention and Early Intervention. FY 12 – 13 Budget Cuts for the DFPS Division of Prevention and Early Intervention. Prevention and Early Intervention. FY 11 Stats. C.1.1. Services to At Risk Youth Appropriation = $21,000,860 34 contracts Average number of youth served monthly = 6,217

E N D
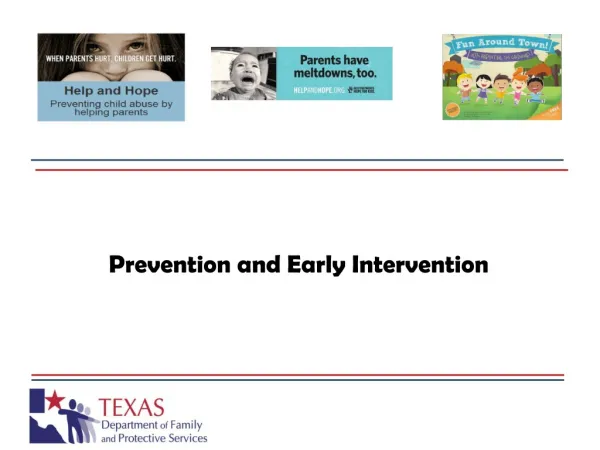
Prevention and Early Intervention FY 12 – 13 Budget Cuts for the DFPS Division of Prevention and Early Intervention
Prevention and Early Intervention FY 11 Stats C.1.1 • Services to At Risk Youth • Appropriation = $21,000,860 • 34 contracts • Average number of youth served monthly = 6,217 • Unduplicated number of youth served annually = 29,730* C.1.2 • Community Youth Development • Appropriation = $7,847,599 • 15 contracts • Average number of youth served monthly = 6,197 • Unduplicated number of youth served annually = 20,850* C.1.3 • Texas Families Together and Safe • Appropriation = $4,121,878 • 9 contracts • Average number of families served monthly = 1,211 • Unduplicated number of families served annually = 4,577* C.1.4 • Community Based Child Abuse Prevention Grant • Appropriation = $1,813,365 • 4 contracts • Average number of families served monthly = 102* • Unduplicated number of families served annually = 420* *Based on contracted output numbers
C.1.5 • Other At Risk Prevention Programs • Appropriation = $8,955,910 • 23 contracts • Average number of children, youth and families served monthly = 5,643 • Unduplicated number of children, youth and families served annually = 7,087* Tertiary Child Abuse Prevention: 1 contract Family Strengthening: 8 contracts Community Based Family Services: 2 contracts Youth Resiliency: 10 contracts Statewide Youth Services Network: 2 contracts Prevention and Early Intervention FY 11 Stats (continued) C.1.6 • At Risk Prevention Program Support • Appropriation = $2,143,959 • 32.5 FTEs • Youth and Runaway Hotlines *Based on contracted output numbers
Prevention and Early Intervention FY 12 Changes C.1.1 • Services to At Risk Youth • Appropriation = $18,283,303 (13% reduction) • 34 contracts • Average number of youth served monthly = 5,359 (14% decrease) • Unduplicated number of youth served annually = negotiating C.1.2 • Community Youth Development • Appropriation = $5,039,300 (36% reduction) • 15 contracts • Average number of youth served monthly = 4,136 (33% decrease) • Unduplicated number of youth served annually = negotiating C.1.3 • Texas Families Together and Safe • Appropriation = $2,610,039 (37% reduction) • 6 contracts (33% reduction) • Average number of families served monthly = 814 (33% decrease) • Unduplicated number of families served annually = negotiating C.1.4 • Community Based Child Abuse Prevention Grant • Appropriation = $1,640,667 (10% reduction) • 4-5 contracts • Average number of families served monthly = contract renewals in progress • Unduplicated number of families served annually = negotiating; procurement
Prevention and Early Intervention FY 12 Changes (continued) C.1.5 • Other At Risk Prevention Programs • Appropriation = $2,290,576 (74% reduction) • 4 contracts (83% reduction) • Average number of children, youth and families served monthly = 1,450 (74% decrease) • Unduplicated number of children, youth and families served annually = negotiating Tertiary Child Abuse Prevention: 1 contract Family Strengthening: 8 contracts Community Based Family Services: 1 contracts Youth Resiliency: 10 contracts Statewide Youth Services Network: 2 contracts C.1.6 • At Risk Prevention Program Support • Appropriation = $1,133,815 (47% reduction) • 18.5 FTEs (43% reduction) • Youth and Runaway Hotlines