Download
1 / 35
370 likes | 576 Views
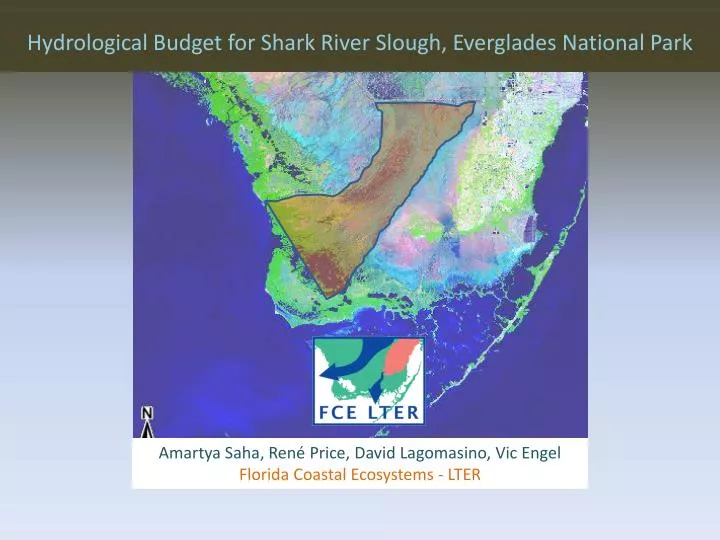
Hydrological Budget for Shark River Slough, Everglades National Park. Amartya Saha , René Price, David Lagomasino , Vic Engel Florida Coastal Ecosystems - LTER. What is a Hydrological or Water Budget ?. How much water ENTERS How much water LEAVES How much water is STORED

E N D
Hydrological Budget for Shark River Slough, Everglades National Park AmartyaSaha, René Price, David Lagomasino, Vic Engel Florida Coastal Ecosystems - LTER
What is a Hydrological or Water Budget? How much water ENTERS How much water LEAVES How much water is STORED Over a PERIOD of time Time scale of budget – Daily, Monthly, Annual Tricky for natural systems
Why… a water budget ? Water is life Hydrologically-controlled ecosystem, where slight changes in topography lead to very different hydroperiods Fauna and flora finely attuned to various hydroperiods, flow regimes and salinity, nutrients, dissolved oxygen
The Everglades Different flooding tolerances Illustration courtesy USGS
Water management for ecosystem preservation : how much water to release so as to maintain proper levels in ENP. This requires knowing how much water enters the ecosystem via various ways and how the water leaves
Water Budget – mass balance Water budget - methodology Δ Volume (Δ volume) = Inflow + Rain – ET – Outflow + net groundwater exchange
Water budget - methodology Data sources (Δ volume): monthly water level difference ( spatial average of LTER, USGS and NPS) Inflow: S12 structures, s333 gates Rain: LTER, SFWMD, ENP and USGS sites – spatial average over slough Discharge: Lostman, Broad, Harney, Shark and North rivers (USGS stations) Evapotranspiration: calculated from meteorological data from 4 towers calibrated a simple radiation-based model to extend over slough. Seepage: Groundwater level data and regression equations
Source: Sobczak R, The South Florida Watershed Journal http://sfwj.blogspot.com/p/everglades.html
Water releases determined by regulation schedules and upstream water levels, and not ENP ecosystem requirements
5 major rivers drain 90% of Shark River Slough water Levesque 2000, USGS
Rainfall sites across SRS – heterogenously scattered Rainfall – stations map Thiessen average polygon
Voronoi polygons/Thiessen method of spatial averaging of rainfall in SRS
Evapotranspiration–No way to measure; Various ways to estimate Remote sensing: NDVI Vapor transport models: Radiation & other met Eddy covariance: Turbulent fluxes Of water, CO2 Ecophysiology: Sapflow, transpiration Groundwater level
EVAPOTRANSPIRATION – customization OF A vapor-transport MODEL fOR the Everglades 4 main parameters: Net radiation Air temperature Windspeed Relative humidity Data – from 4 meteorological towers inside the ENP STEPS 1. FAO-PM equation (Allen at el 2004) – the global standard reference ET for crops (monocultures, no water limitation) 2. Shuttleworth PM model (Maidment 1993) – includes vegetation parameters but no transpiration limitation . Add a seasonal transpiration limitation function 3. Compare values with field studies and remote sensing estimates
FAO-PM equation (Allen at el 2004) the global standard reference ET for crops ETo : reference evapotranspiration [mm day-1] Rn : net radiation at the crop surface [MJ m-2 day-1],\ G : soil heat flux density [MJ m-2 day-1] T : mean daily air temperature at 2 m height [°C] u2 : wind speed at 2 m height [m s-1] es : saturation vapour pressure [kPa] ea : actual vapour pressure [kPa] es - ea : saturation vapour pressure deficit [kPa] Δ : slope vapour pressure curve [kPa °C-1] γ : psychrometric constant [kPa °C-1]
ET Stations Eddy-flux towers- Steve Oberbauer- FIU Eddy-flux tower- University of VA Campbell Scientific, Inc. ET106 Evapotranspiration Station at TS/PH-7b
Jan Feb Mar Apr May Jun Jul Aug Sep Oct Nov Dec
However, wildland forests are not crop monocultures… • Transpiration can differ for • species • plant community – sawgrass marsh, hammock forests, mangroves • change with water stress caused by salinity, drydown, drought • Plants shut down transpiration for months at a time, even though leaves • are retained.
Evapotranspiration (continued) Shuttleworth PM equation with Leaf Area Index and vegetation height * (Sin(θ) + 1)/2 added a plant water stress sinusoidal function for seasonality in transpiration amounts (Feb-May) A few field estimates In marshes: Abtew (1996, 2006): dry season 1-3 mm/day, wet season 5-6 mm/day
April 23, 2008 Lagomasino D & Price R, unpublished
Seepage under L-31 Source: Nemeth, Wilcox & Solo-Gabriele 2000
Seepage calculations - 2 Regression equations relating Groundwater head difference In well pairs across Levee L-31
Results Groundwater contribution to discharge: 490 mm/year, or 668832 acre-ft
Conclusions Groundwater discharge is a component of outflow to the Gulf of Mexico -- just south of Tamiami Trail -- coastal margins of Shark River Slough (Coastal Groundwater Discharge) 2. Precipitation (biggest input), ET (biggest output) Hence, inflows need to be increased for maintaining the ecosystem and to provide a bulwark against salt water intrusion