Download
1 / 24
460 likes | 852 Views
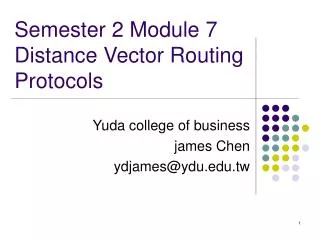
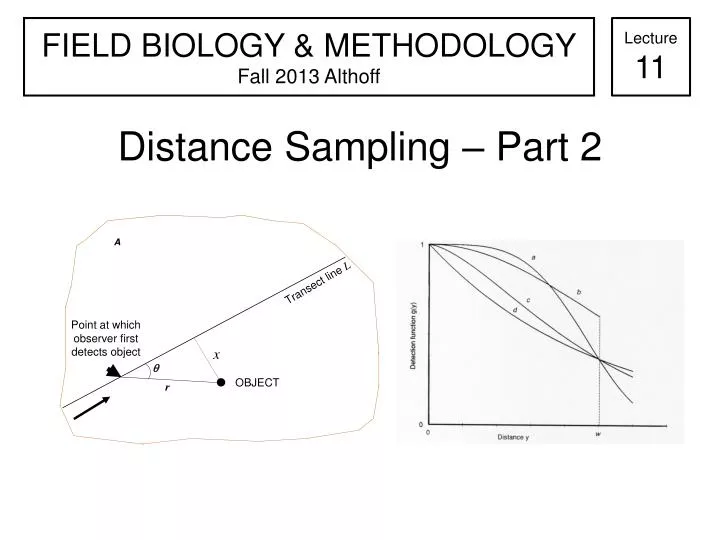
FIELD BIOLOGY & METHODOLOGY Fall 2013 Althoff. Lecture 11. Distance Sampling – Part 2. Transect line L. Point at which observer first detects object. x = perpendicular distance. OBJECT. A. Transect line L. Point at which observer first detects object.

E N D
FIELD BIOLOGY & METHODOLOGYFall 2013 Althoff Lecture 11 Distance Sampling – Part 2
Transect line L Point at which observer first detects object x = perpendicular distance OBJECT A
Transect line L Point at which observer first detects object x = perpendicular distance q r OBJECT A
Brings us to 3 major assumptions of DS • Objects directly on the line (or point) are always detected (i.e., they are detected with probability 1, or g(0) =1) • Objects are detected at their initial location, prior to any movement in response to the observer • Distances (and angles where relevant) aremeasured accurately (ungrouped data) or objects are correctly counted in the proper distance interval (grouped data) 1 2 3
Transect line L Detection probability of 1
Processing & Examining Distance Data • Assuming one has obtained “accurate” estimates of distances to detected objects (i.e., bird, mammal, frog, nest, dung pile, etc.), then one have a raw data file • The raw data file will include “___________”. It is generally assumed that not all objects of interest were “detected”. Therefore, examining the data, by _________________ is important to see the “pattern” of detections relative to the line (or the point if point counts).
Use of Histograms • By generating a histogram of the detections by distance intervals, we can gain insight into the following: • If ______ objects of interest were detected • _____________________ starts to occur away from the observer(s) that objects are less likely to be detected or not detected at all • Where _________________________ might be affecting detections…and eventually affecting the resulting _________________
Histogram – Expected number of detections in 8 distance classes___________________________ 100 Frequency (number of detections) 50 0 1 2 3 4 5 6 7 8 Distance (ft)
Histogram – Expected number of detections in 8 distance classeswith tendency to detect ________ objects at ____________ distances 100 Frequency (number of detections) 50 0 1 2 3 4 5 6 7 8 Distance (ft)
Histogram – Expected number of detections in 8 distance classeswith tendency to detect fewer objects at greater distances 100 Frequency (number of detections) 50 0 1 2 3 4 5 6 7 8 Distance (ft)
Histogram – Expected number of detections in 8 distance classeswith tendency to detect fewer objects at greater distances 100 Frequency (number of detections) 50 0 1 2 3 4 5 6 7 8 Distance (ft)
Correction Factor • Because ___________________would be detected in the ‘width’ of the area sampled, an adjustment is made to account for that • It is estimated from the ________________ • Example: If 62 detections in “area” sampled, then multiple, in this case, 62 x 1.126 to estimate objects (individuals, nests, etc.) . Result = ___________________
From distance data, a “___________________” is generated g(y)
Detection function • ___ = the ____________________ an object, given that it is at distance y from the random line or point = pr { detection| distance y} • y is the perpendicular distance x for line transects or the sighting (radial) distance r for point transects.
Detection function…con’t • Use ____________________ to calculate the detection function • _____ from sampling effort to sampling effort • _____ most likely from species to species • _____ most likely from geographic area to geographic area • …in other words, _____ likely to get identical detection functions from one effort to the next
Strip Transect Method Point Count Method
Dickcissels Point Counts Strip Transect
Grasshopper Sparrow Point Counts Strip Transect
Brown-headed Cowbird Point Counts Strip Transect
In summary...and/or recommendations. • Number of detections usually are a function of ________ from the line or point …usually _____ the further the object(s) are from the line or point • _______________ is used to generate a detection function • The detection function can be used to “______” counts to give popn estimate—more later • Generally need __________________________ to determine the detection function with any degree of statistical confidence