Download
1 / 30
300 likes | 311 Views
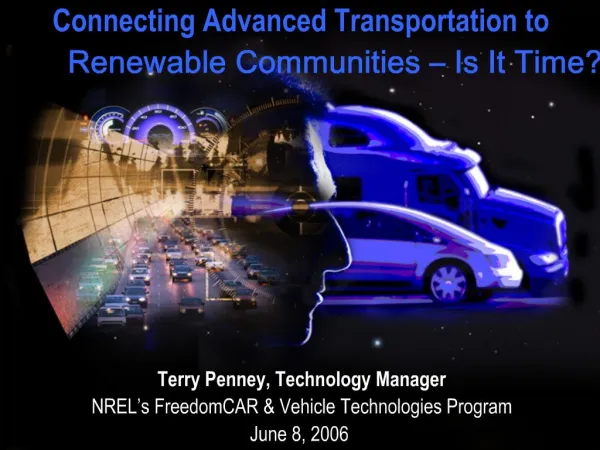
Explore the significant energy use and CO2 emissions from the transportation sector, focusing on the impact of oil-based fuels and key statistics. Discover projections for personal transport demand driven by income growth and the importance of well-to-wheels emissions analysis for policy evaluation. Learn about emissions from different fuel/propulsion systems and simulations on reducing worldwide GHG emissions from road vehicles by 2050.

E N D
Transportation, Energy, and Emissions: An Overview Presentation by Dr. George C. Eads Vice President, CRAI International Conference on Global Energy and Climate Change Lake Arrowhead, California October 22, 2006
Transport sector is a very large user of energy 29% 26% Source: WEO2004 *Includes residential, commercial & public services, and agriculture
… and one of the largest emitters of CO2Energy-related CO2 emissions by sector (Mt) 23% * 21% Source: IEA WEO2004 *Includes residential, commercial & public services, and agriculture
Well over 90% of transport fuels are oil-basedShare of transport energy by fuel Source: IEA/SMP Spreadsheet Model Reference Case
The transport sector is by far the largest user of oil Source: IEA WEO2004
Three transport modes account for about 80% of all transport energy use Source: IEA/SMP Spreadsheet Model Reference Case
The same three modes also account for about 80% of transport vehicle CO2 emissions Source: SMP/IEA Spreadsheet Model Reference Case
At present, the OECD countries are responsible for nearly 70% of transport energy use, but this will change Source: SMP/IEA Spreadsheet Model Reference Case
They also are responsible for approximately 80% of CO2 emissions from LDVs… Source: SMP/IEA Spreadsheet Model Reference Case
…for about 55% of the emissions from medium and heavy duty freight trucks Source: SMP/IEA Spreadsheet Model Reference Case
…and for about 75% of air transport emissions Source: SMP/IEA Spreadsheet Model Reference Case Note: One half of emissions from flights between regions allocated to each region Note: Does not account for contrails, NOx, etc.
The principal driver of transport energy and transport CO2 growth has been – and will continue to be -- growth the demand for personal and goods transport services
These personal transport demand projections do not imply private motorized vehicle ownership rates typical of OECD countries
Nor do they imply personal transport levels per capita that are equivalent to today’s OECD country levels Source: SMP/IEA Spreadsheet Model Reference Case
They are driven by growth in real per capita incomeRelationship between per capita personal travel and per capita real income, 2000 Source: SMP/IEA Spreadsheet Model Reference Case
Projected growth in real per capita GDP (PPP basis) Source: SMP/IEA Spreadsheet Model Reference Case
What these growth rates imply for future income levelsLevel and average annual rate of growth of real per capita GDP (PPP basis) Source: SMP/IEA Spreadsheet Model Reference Case
Why we need to think in terms of “well-to-wheels” emissions when evaluating policies to reduce transport-related GHG emissions • Transport-related CO2 emissions are the sum of three emissions categories • Vehicle emissions (TTW) = emissions from the combustion of fuel by the vehicle’s engine • Fuel cycle emissions (WTT) = emissions associated with the production and distribution of transport fuel • Vehicle manufacturing, distribution, and disposal emissions • For a MY1996 midsize US passenger car, each category is estimated to be responsible for the following share of total transport-related emissions over the life of the vehicle: • Vehicle emissions: 75% • Fuel cycle emissions: 19% • Vehicle manufacturing, distribution, and disposal emissions: 7% • These percentages are likely to change radically in the future
“Well-to-wheels” emissions of different fuel/propulsion system combinations – mid-sized European passenger car ICE ICE Hybrid Fuel Cell Source: SMP, Mobility 2030
“Well-to-wheels” emissions of different fuel/propulsion system combinations Source: SMP, Mobility 2030
“Well-to-wheels” emissions of different fuel/propulsion system combinations Source: SMP, Mobility 2030
Impact of various vehicle technologies and fuels transport-related GHG emissionsEmissions simulations using the SMP/IEA spreadsheet model • SMP conducted two “illustrative simulations” • Simulations tried to capture in-use effectiveness (not theoretical potential) of technologies and timing of their introduction and widespread diffusion • Simulations didn’t consider costs or consumer acceptance in determining timing or introduction or rates of diffusion
Simulation #1: Impact of individual technologies on worldwide WTW GHG emissions from road vehicles
Simulation #2 – Identify plausible combination of actions that could return worldwide road vehicle WTW GHG emission to their 2000 level by 2050 Σ(1+2+3+4+5)
Some concluding observations • Growth in demand for transport services (personal and freight) has been the primary driver of transport energy demand and transport-related GHG emissions. Demand for transport services will continue to grow as incomes grow. The rate of growth of demand for transport services is not immutable, but shouldn’t underestimate difficulty of change. • Eventually, transport must be largely eliminated as a significant source of GHG emissions. To do this, transport GHG emissions must be decoupled from transport energy use. Requires renewables and/or carbon sequestration of emissions from production of synthetic fuels. • Transport energy use likely to grow more rapidly than demand for transport services due to the increased energy requirements of producing carbon-free transport fuels. • In the very long run, transport vehicle energy efficiency is likely to become virtually irrelevant to transport GHG emissions; it will only determine the amount of carbon-free transport fuel that must be produced.
Simulation #1 Assumptions • Diesel ICE technology (using conventional diesel fuel) was assumed to have an 18% fuel consumption benefit versus the prevailing gasoline ICE technology during the entire period • Fuel consumption benefit relative to gasoline ICE technology assumed to be 36% for diesel hybrids, 30% for gasoline hybrids, and 45% for fuel-cell vehicles. • For diesels and advanced hybrids, 100% sales penetration (worldwide) reached by 2030 in light-duty vehicles and medium-duty trucks • For fuel cells,100% sales penetration (worldwide) reached by 2050; hydrogen produced by reforming natural gas, no carbon sequestration • For “carbon neutral” hydrogen, change WTT emissions characteristics of the hydrogen used in fuel cell case above • For biofuels, assumed that would be used in a world road vehicle fleet similar in energy use characteristics to the SMP reference fleet Note: impacts are not additive
Simulation #2 Applied seven “increments”* in order shown (are additive, but order matters) • Dieselisation. For light-duty vehicles and medium-duty trucks, rises to around 45% globally by 2030. • Hybridisation. For light-duty vehicles and medium-duty trucks increases to half of all ICE vehicles sold by 2030. • Conventional and advanced biofuels. The quantity of biofuels in the total worldwide gasoline and diesel pool rises steadily, reaching one-third by 2050. • Fuel cells using hydrogen derived from fossil fuels (no carbon sequestration). Mass market sales of light-duty vehicles and medium-duty trucks start in 2020 and rise to half of all vehicle sales by 2050. • Carbon neutral hydrogen used in fuel cells. Hydrogen sourcing for fuel cells switches to centralized production of carbon-neutral hydrogen over the period 2030-2050 once hydrogen LDV fleets reach significant penetration at a country level. By 2050, 80% of hydrogen is produced by carbon-neutral processes. • Additional fleet-level vehicle energy efficiency improvement. SMP reference case projects an average improvement in the energy efficiency of the on-road light-duty vehicle fleet of about 0.4% per year. We assume that the average annual in-use fleet-level improvement rises by an additional10% (i.e., from about 0.4% to about 0.6%). • A 10% reduction in emissions due to better traffic flow and other efficiency improvements in road vehicle use. *Assumptions of effectiveness of technologies identical to those used in prior simulation
SMP/IEA spreadsheet modelModel and documentation available at www.sustainablemobility.org • Model developed jointly by SMP and the IEA’s Energy Technology Policy Division • Model benchmarked to IEA’s World Energy Outlook (WEO2002) • WEO projections only extend to 2030; model extrapolates to 2050 • Model covers same regions/countries as WEO, but much more modal detail • Regions/countries • OECD Europe, OECD North America, OECD Pacific, Former Soviet Union, Eastern Europe, China, Other Asia, India, Middle East, Latin America, and Africa • Modes • Light duty personal vehicles, motorized 2 and 3 wheelers, buses, medium and heavy freight trucks, passenger and freight rail, air transport, internal and overseas waterborne • Emissions projections include fuel cycle as well as vehicle emissions, though are calculated separately • WTT emissions include N2O and CH4 • Model used to generate “reference case” • Assumes that “present trends continue” • Policies already being implemented are completed; no new policies assumed • Model also used to conduct simulations