Download
1 / 27
270 likes | 347 Views
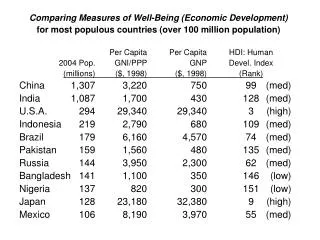
Explore inequality within and between classes using income measures, discuss comprehensive income, class determination, household characteristics, and income sources in the US from 1989 to 2000.

E N D
Class Structure and Household Economic Well-Being Ed Wolff Ajut Zacharias Discussant: Stephan Klasen.
Summary 1 • Purpose of Paper: Investigate inequality within and between „classes“ using comprehensive income measure for US, 1989 and 2000. • Concept of Class: Determination by Net worth, occupational titles, and self-employment: Capitalists (net worth>$5m.), no compulsion to work, five laboring classes (managers, supervisors, white-collar skilled, blue-collar skilled, unskilled), and self.-employed. • Assignment based on CPS, Annual Demographic Supplement matched (nearest neighbour) with SCF to dientify capitalists. Household based but using characteristics of ‚reference person‘. • Comment: Where are workless households? Do these groups have common interests/ agendas/ consciousness? How many capitalists labor?
Summary 2 • Chacteristics of ‚reference person‘ • 88% of capitalists white (73% of non-capitalists) • Gender and age characteristics hard to interpret and contigent on definition of ‚reference person‘ (and not so relevant since is it a household level concept) • Education characteristics as expected (and similar problem as above)
Summary 3 • Derivation of ‚Comprehensive Income‘ measure: • Subtracts consumption taxes • Adds income from wealth (home and non-home) cash and non-cash transfers. Differences to ‚Extended Income‘ (Census Bureau): • Uses annuity value from non-home wealth • Uses imputed rent on owner-occupied housing (minus mortgage payments) • Uses full cost (insurance) value of non-cash transfers
Summary 4 • Total inequality (Gini) decomposition using Ytzaki (1994) framework:
Summary 4 • Inequality and Income Sources: Using CI, capitalists have higher incomes from wealth and that has increased dramatically 1989-2000 • Gini decomposition by income shows rising inequality in CI driven by that (rising inequality in EI driven by contribution from base, i.e. money, income).
Comments • Nice paper, lots of good empirical work, careful data analysis; • Why is class a useful concept (other than history of thought relevance)? (But how useful is quintile?) • Ytzaki decomposition not very intuitive and ‚overlap term‘ a form of between-inequality? • Using Theil decompositions to show that between class term is more significant than other ways to slice the data (e.g. race, region, education) • Earnings versus household income: class based on labor and earnings, then other incomes added. Problem?
Welfare State Expenditures and the Redistribution of Well-Being: Children, Elders, and Others in Comparative Perspective Irwin Garfinkel, Lee Rainwater, Tim Smeeding Discussant: Stephan Klasen.
Summary 1 • Purpose of Paper: Measure redistribution by state including taxes, cash and in-kind benefits in 10 OECD countries. • Accounting Exercise (abstracting from changes in behavior, particularly household formation behavior). • Base data: after tax LIS data (what about income from owner-occupied housing?) • Added: sales, VAT, excise, corporate taxes, government health and education spending (plus employer health provisions in US): Taxes forced to equal expenditures!
Summary 2 • Many details on imputations (mostly reasonable, some open to question) . • Education: only primary and secondary and allocated to households with relevant age children; random allocation of early childhood education. • Health: public spending allocated in age-increasing gradient; US: allocation of employer-provided health care.
Further Results • Elderly net recipients, childless households net payers (but large redistribution within groups) • Average benefits assumption changes redistributive role of government the most for elderly (by construction, main beneficiaries of large health spending in US)
Comments • Nice, careful, and comprehensive study; • High in-kind benefits in US worth as much to recipients? • What is ‚public health‘ spending in Germany (includes employer and employee contribution?) • Tertiary education could (and should) be included using different household surveys (and published work); • Many childless households remain childless (33% in Germany), so permanent not life-cycle subsidy. • P10/P50 among childed households ‚equality of opportunity‘ in sense of Roemer (1998) and WDR (2005)?
Income Inequality Across Regions of Russian Federation (1995-2003) Irina Gerasimova Discussant: Stephan Klasen.
Summary 1 • Purpose of paper: describe inequality trends by regions and income sources from published sources for Russia; • Data: published ROSSTAT aggregate data (some discussion of data inconsistencies with other sources) • Describe Gini and income components by region (78) over time • Generate deciles of regions (7-8 regions each) to generate Gini for total money income and income components
Comments • Nice study highlighting importance of regional inequality, centralitiy of Moscow region, and role of income sources; • Questions about data reliability (and definitions, e.g. ‚other incomes‘) • Within-Russia inequality convergence? • Table 1/Figure 1 should not use ‚maximum Gini‘ from WIID database. • Why first aggregate to regions and then calculate Ginis (throwing away information)? • Clear limits to aggregate data: need to investigate this using micro data (RLMS?) and doing full decompositions. • More clarifications on terms and concepts needed.