Download
1 / 1
10 likes | 160 Views
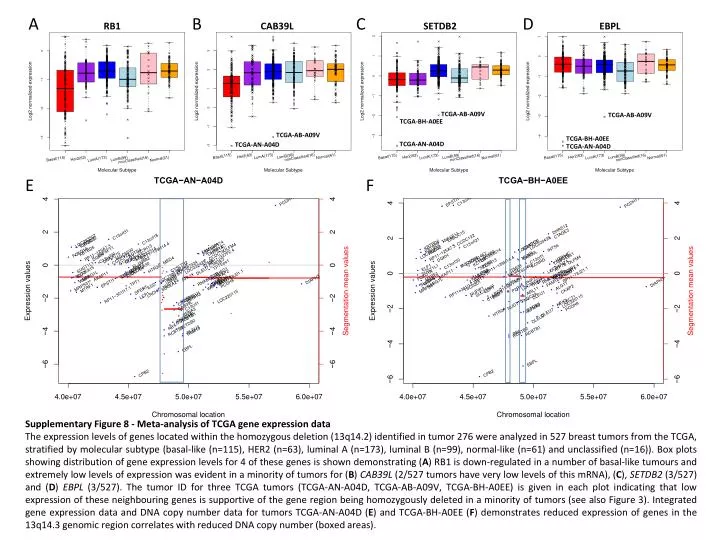
A. B. C. D. RB1. CAB39L. SETDB2. EBPL. TCGA-AB-A09V. TCGA-AB-A09V. TCGA-BH-A0EE. TCGA-AB-A09V. TCGA-BH-A0EE. TCGA-AN-A04D. TCGA-AN-A04D. TCGA-AN-A04D. E. F. Supplementary Figure 8 - Meta-analysis of TCGA gene expression data

E N D
A B C D RB1 CAB39L SETDB2 EBPL TCGA-AB-A09V TCGA-AB-A09V TCGA-BH-A0EE TCGA-AB-A09V TCGA-BH-A0EE TCGA-AN-A04D TCGA-AN-A04D TCGA-AN-A04D E F Supplementary Figure 8 - Meta-analysis of TCGA gene expression data The expression levels of genes located within the homozygous deletion (13q14.2) identified in tumor 276 were analyzed in 527 breast tumors from the TCGA, stratified by molecular subtype (basal-like (n=115), HER2 (n=63), luminal A (n=173), luminal B (n=99),normal-like (n=61) and unclassified (n=16)). Box plots showing distribution of gene expression levels for 4 of these genes is shown demonstrating (A) RB1is down-regulated in a number of basal-like tumours and extremely low levels of expression was evident in a minority of tumors for (B) CAB39L(2/527 tumors have very low levels of this mRNA), (C), SETDB2 (3/527) and (D) EBPL (3/527). The tumor ID for three TCGA tumors (TCGA-AN-A04D, TCGA-AB-A09V, TCGA-BH-A0EE) is given in each plot indicating that low expression of these neighbouring genes is supportive of the gene region being homozygously deleted in a minority of tumors (see also Figure 3). Integrated gene expression data and DNA copy number data for tumors TCGA-AN-A04D (E) and TCGA-BH-A0EE (F) demonstrates reduced expression of genes in the 13q14.3 genomic region correlates with reduced DNA copy number (boxed areas).