Download
1 / 67
900 likes | 2.14k Views
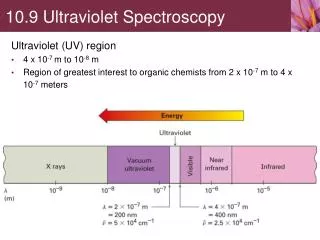
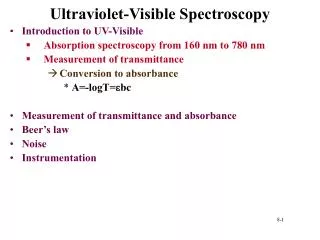
ULTRAVIOLET-VISIBLE SPECTROSCOPY. Semester Dec – Apr 2010. In this lecture, you will learn:. Molecular species that absorb UV/VIS radiation Absorption process in UV/VIS region in terms of its electronic transitions Important terminologies in UV/VIS spectroscopy.

E N D
ULTRAVIOLET-VISIBLE SPECTROSCOPY Semester Dec – Apr 2010
In this lecture, you will learn: • Molecular species that absorb UV/VIS radiation • Absorption process in UV/VIS region in terms of its electronic transitions • Important terminologies in UV/VIS spectroscopy
MOLECULAR SPECIES THAT ABSORB UV/VISIBLE RADIATION Inorganic species Organic compounds Charge transfer
Definitions: • Organic compound • Chemical compound whose molecule contain carbon. • E.g. C6H6, C3H4 • Inorganic species • Chemical compound that does not contain carbon. • E.g. transition metal, lanthanide and actinide elements • Cr, Co, Ni, etc.. • Charge transfer • A complex where one species is an electron donor and the other is an electron acceptor. • E.g. iron(III) thiocyanate complex
UV-VIS ABSORPTION • In UV/VIS spectroscopy, the transitions which result in the absorption of EM radiation in this region are transitions btw electronic energy levels.
Molecular absorption - In molecules, not only have electronic level but also consist of vibrational and rotational sub-levels. - This result in band spectra.
Type of Transitions • 3 types of electronic transitions • σ, п and n electrons • d and f electrons • Charge transfer electrons
Sigma ()electron • Electrons involved in single bonds such as those between carbon and hydrogen in alkanes. • These bonds are called sigma (σ) bonds. • The amount of energy required to excite electrons in σ bond is more than UV photons of wavelength. For this reason, alkanes and other saturated compounds (compounds with only single bonds) do not absorb UV radiation and therefore frequently very useful as transparent solvents for the study of other molecules. For example, hexane, C6H14.
Pi () electron • Electrons involved in double and triple bonds (unsaturated). • These bonds involve a pi (п) bond. • For example: alkenes, alkynes, conjugated olefins and aromatic compounds. • Electrons in п bonds are excited relatively easily; these compounds commonly absorb in the UV or visible region.
Examples of organic molecules containing пbonds. propyne ethylbenzene benzene 1,3-butadiene
n electron • Electrons that are not involved in bonding between atoms are called n electrons. • Organic compounds containing nitrogen, oxygen, sulfur or halogens frequently contain electrons that are nonbonding. • Compounds that contain n electrons absorb UV/VIS radiation.
Examples of organic molecules with non-bonding electrons. Carbonyl compound If R = H aldehyde If R = CnHn ketone aminobenzene 2-bromopropene
Absorption by Organic Compounds • UV/Vis absorption by organic compounds requires that the energy absorbed corresponds to a jump from occupied orbital unoccupied orbital. • Generally, the most probable transition is from the highest occupied molecular orbital (HOMO) to the lowest unoccupied molecular orbital (LUMO).
Electronic energy levels diagram Unoccupied levels Occupied levels
* transitions • Never observed in normal UV/Vis work. • The absorption maxima are < 150 nm. • The energy required to induce a σ σ* transition is too great (see the arrow in energy level diagram) • This type of absorption corresponds to breaking of C-C, C-H, C-O, C-X, ….bonds σ σ* vacuum UV region
n * transitions • Saturated compounds must contain atoms with unshared electron pairs. • Compounds containing O, S, N and halogens can absorb via this type of transition. • Absorptions are typically in the 150 -250 nm region and are not very intense. • ε range: 100 – 3000 Lcm-1mol-1
n * transitions • Unsaturated compounds containing atoms with unshared electron pairs • These result in some of the most intense absorption in 200 – 700 nm region. • ε range: 10 – 100 Lcm-1mol-1
* transitions • Unsaturated compounds to provide the orbitals. • These result in some of the most intense absorption in 200 – 700 nm region. • ε range: 10oo – 10,000 Lcm-1mol-1
Some examples of absorption due to n* and * transitions
CHROMOPHORE • Unsaturated organic functional groups that absorb in the UV/VIS region are known as chromophores.
AUXOCHROME • Groups such as –OH, -NH2 & halogens that attached to the doubley bonded atoms cause the normal chromophoric absorption to occur at longer λ (red shift). These groups are called auxochrome.
Effect of Multichromophores on Absorption • More chromophores in the same molecule cause bathochromic effect ( shift to longer ) and hyperchromic effect(increase in intensity) • In the conjugated chromophores * electrons are delocalized over larger number of atoms causing a decrease in the energy of * transitions and an increase in due to an increase in probability for transition.
Other Factor that Influenced Absorption • Factors that influenced the λ: i) Solvent effects (shift to shorter λ: blue shift) ii) Structural details of the molecules
Important terminologies • hypsochromic shift (blue shift) - Absorption maximum shifted to shorter λ • bathochromic shift (red shift) - Absorption maximum shifted to longer λ
Absorption by Inorganic Species Involving d and f electrons absorption • 3d & 4d electrons - 1st and 2ndtransition metal series e.g. Cr, Co, Ni & Cu - Absorb broad bands of VIS radiation - Absorption involved transitions btw filled and unfilled d-orbitals with energies that depend on the ligands, such as Cl-, H2O, NH3 or CN- which are bonded to the metal ions.
4f & 5f electrons - Ions of lanthanide and actinide elements - Their spectra consists of narrow, well-defined characteristic absorption peaks
Charge Transfer Absorption • Absorption involved transfer of electron from the donor to an orbital that is largely associated with the acceptor. • an electron occupying in a σ or orbital (electron donor) in the ligand is transferred to an unfilled orbital of the metal (electron acceptor) and vice-versa. • e.g. red colour of the iron(III) thiocyanate complex
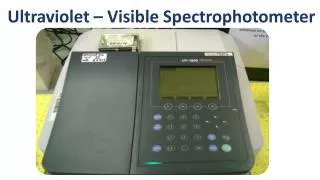
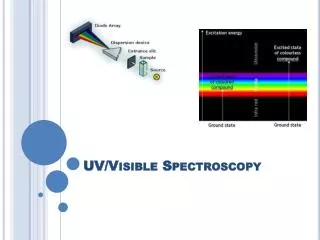
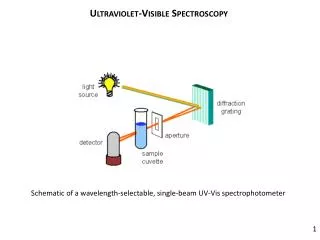
Important components in a UV-Vis spectrophotometer 1 2 5 3 4 Source lamp Sample holder Signal processor & readout λselector Detector UV region: - Deuterium lamp; H2 discharge tube Phototube, PM tube, diode array Quartz/fused silica Prism/monochromator Visible region: - Tungsten lamp Prism/monochromator Glass/quartz Phototube, PM tube, diode array
UV-VIS INSTRUMENT • Single beam • Double beam
Single beam instrument • One radiation source • Filter/monochromator (λ selector) • Cells • Detector • Readout device
Single beam instrument • Disadvantages: • Two separate readings has to be made on the light. This results in some error because the fluctuations in the intensity of the light do occur in the line voltage, the power source and in the light bulb btw measurements. • Changing of wavelength is accompanied by a change in light intensity. Thus spectral scanning is not possible.
Double beam instrument Double-beam instrument with beams separated in space
Advantages: 1. Compensate for all but most short-term fluctuations in the radiant output of the source as well as for drift in the transducer and amplifier 2. Compensate for wide variations in source intensity with λ 3. Continuous recording of transmittance or absorbance spectra Double beam instrument
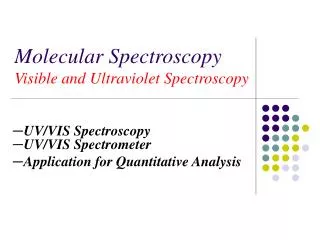
Quantitative Analysis • The fundamental law on which absorption methods are based on Beer’s law (Beer-Lambert law).
Measuring absorbance • You must always attempt to work at the wavelength of maximum absorbance (max) • This is the point of maximum response, so better sensitivity and lower detection limits. • You will also have reduced error in your measurement.
Quantitative Analysis Calibration curve method Standard addition method
Calibration curve method • A general method for determining the concentration of a substance in an unknown sample by comparing the unknown to a set of std sample of known concentration
Standard Calibration Curve Absorbance • How to measure the concentration of unknown? • Practically, you have measure the absorbance of your unknown. Once you know the absorbance value, you can just read the corresponding concentration from the graph . Concentration, ppm
How to produce standard calibration curve? A • Prepare a series of standard solution with known concentration. • Measure the absorbance of the standard solutions. • Plot the graph A vs concentration of std. • Find the ‘best’ straight line by using least-squares method.
Finding the Least-Squares Line N = 5 N – is the number of points used