Download
1 / 48
3.44k likes | 16.43k Views
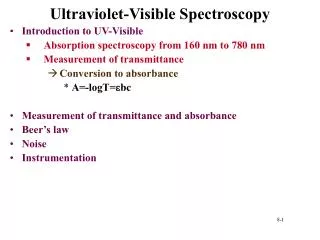
Ultraviolet-Visible Spectroscopy. Introduction to UV-Vis spectroscopy Measurement of UV-Vis spectroscopy ----- Lambert-Beer Law Instrumentation of UV-Vis spectroscopy Application of UV-Vis spectroscopy. Introduction to UV-Vis spectroscopy.

E N D
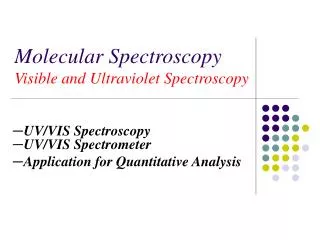
Ultraviolet-Visible Spectroscopy • Introduction to UV-Vis spectroscopy • Measurement of UV-Vis spectroscopy -----Lambert-Beer Law • Instrumentation of UV-Vis spectroscopy • Application ofUV-Vis spectroscopy
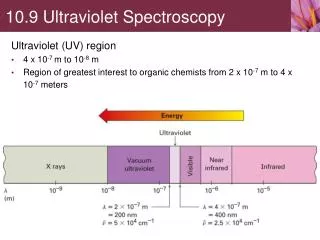
Introduction to UV-Vis spectroscopy • The energy associated with a given segment of the spectrum is proportional to its frequency. The bottom equation describes this relationship, which provides the energy carried by a photon of a given wavelength of radiation.
Introduction to UV-Vis spectroscopy • The visible region of the spectrum comprises photon energies of 36 to 72 kcal/mole, • the near ultraviolet region, out to 200 nm, extends this energy range to 143 kcal/mole. • Ultraviolet radiation having wavelengths less than 200 nm is difficult to handle, and is seldom used as a routine tool for structural analysis. • UV-Vis spectroscopy200~800nm
Introduction to UV-Vis spectroscopy • Is chlorophyll green ? When white light passes through or is reflected by a colored substance, a characteristic portion of the mixed wavelengths is absorbed. The remaining light will then assume the complementary color to the wavelength(s) absorbed.
Introduction to UV-Vis spectroscopy Chlorophyll-a absorption spectrum
Introduction to UV-Vis spectroscopy complementary color
Introduction to UV-Vis spectroscopy • the light energy will be absorbed as the electron is promoted to a higher energy orbital. • An optical spectrometer records the wavelengths at which absorption occurs, together with the degree of absorption at each wavelength. The resulting spectrum is presented as a graph of absorbance (A) versus wavelength
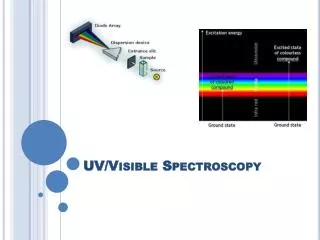
Introduction to UV-Vis spectroscopy • UV-Vis is molecular absorption spectroscopy What are the nature of these absorptions? as UV or visible light irradiate molecules, electrons in the lowest molecular orbital may be excited and transfer to an orbital of higher energy
Eeenergies for electronic transition of atoms in the molecule Evenergies for vibration between two atoms Er energies for molecular rotation
Absorbing species • Electronic transitions • p, s, and n electrons • d and f electrons • Charge transfer reactions • p, s, and n (non-bonding) electrons
Electron transitions • The diagram showing the various kinds of electronic excitation that may occur in organic molecules is shown. Of the six transitions outlined, only the two lowest energy ones (left-most, colored blue) are achieved by the energies available in the 200 to 800 nm spectrum.
Transitions • s->s* • UV photon required, high energy • Methane at 125 nm • Ethane at 135 nm • n-> s* • Saturated compounds with unshared e- • Absorption between 150 nm to 250 nm • e between 100 and 3000 L cm-1 mol-1 • Shifts to shorter wavelengths with polar solvents • Minimum accessibility • Halogens, N, O, S
From the chart above it should be clear that the only molecular moieties likely to absorb light in the 200 to 800 nm region are pi-electron functions and hetero atoms having non-bonding valence-shell electron pairs. Such light absorbing groups are referred to as chromophores.
Transitions • n->p*, p->p* • Organic compounds, wavelengths 200 to 700 nm • Requires unsaturated groups • n->p* low e (10 to 100) • Shorter wavelengths • p->p* higher e (1000 to 10000)
Ultraviolet-Visible Spectroscopy • transmittance • absorbance • Beer’s law
I0 (power in) I (power out) The Quantitative Picture • Transmittance: T = I/I0 • Absorbance: A = -log10 T = log10 I0/I B(path through sample)
Measurement • Because the absorbance of a sample will be proportional to the number of absorbing molecules in the spectrometer light beam (e.g. their molar concentration in the sample tube)
Measurement The Beer-Lambert Law A =ebc Where the absorbance A has no units, since A = log10 I0 / I eis the molar absorbtivity with units of L mol-1 cm-1 b is the path length of the sample in cm c is the concentration of the compound in solution, expressed in mol L-1 (or M, molarity)
Molar absorptivity • it is necessary to correct the absorbance value for this and other operational factors if the spectra of different compounds are to be compared in a meaningful way.
Molar absorptivity • The corrected absorption value is called "molar absorptivity", and is particularly useful when comparing the spectra of different compounds and determining the relative strength of light absorbing functions (chromophores). • Molar absorptivity (ε) is defined as: ε = A/ c l
Beer’s Law Limitations • Equilibrium shift • pH indicators • Need to consider speciation • Weak acid equilibrium
Beer’s Law Limitation • Polychromatic Light • More than one wavelength
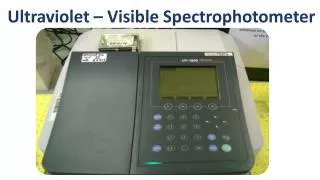
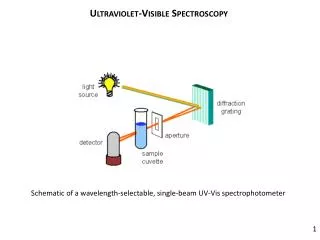
Instrumentation • Light source • Deuterium and hydrogen lamps • W filament lamp • Xe arc lamps • Sample containers • Cuvettes • Plastic • Glass • Quartz
Spectrometer Time separated double beam
Spectrometer Dip probe Multichannel photodiode array
Application of UV-Visible Spectroscopy • Identification of inorganic and organic species • Widely used method • Magnitude of molar absorptivities • Absorbing species • methods
Molar Absorptivties • Range from 0 to 1E5 • e=8.7E19PA • P=transition probability • A=target cross section (cm2) • Allowed transitions 0.1>P>1 • e range 1E4 to 1E5 • Forbidden transition 0.01 • Absorbing species • M+g->M* • M* has a short lifetime (nanoseconds) • Relaxation processes • Heat • Photo emission • Fluorescence or phosphorescence
Transitions • d-d • 3d and 4d 1st and 2nd transitions series • Broad transitions • Impacted by solution
D transitions • Partially occupied d orbitals • Transitions from lower to higher energy levels • Splitting of levels due to spatial distribution similar Axial direction
D transitions • Binding ligands on axis have greater effect on axial orbitals
D transitions • D value dependent upon ligand field strength • <Br-<Cl-<F-<OH-<C2O42-~H2O<SCN-<NH3<en<NO2-<CN- • D increases with increasing field strength • f-f • 4f and 5f (lanthanides and actinides) • Sharper transitions
Actinide transitions Figure 2: UV-vis spectra of organic phases for 13M HNO3 system
Charge-transfer Transitions • Electron donor and acceptor characteristics • Absorption involves e- transitions from donor to acceptor • SCN to Fe(III) • Fe(II) and neutral SCN • Metal is acceptor • Reduced metals can be exception
Electronic Spectra • Cr(NH3)63+ • d3 • Weak low energy transition • Spin forbidden • 2 stronger transitions • Spin allowed • t2g and eg transitions • Lower energy to higher energy • CT at higher energy • Ligand to metal transition
Charge transfer bands • High energy absorbance • Energy greater than d-d transition • Electron moves between orbitals • Metal to ligand • Ligand to metal • Sensitive to solvent • LMCT • High oxidation state metal ion • Lone pair ligand donor • MLCT • Low lying pi, aromatic • Low oxidation state metal • High d orbital energy
Methods • Titration • Change of absorbance with solution variation • pH, ligand, metal • Photoacoustic effect • Emission of sound